RiverSMART
Help Information
Table
of Contents
Background
The RiverWare Study Manager and
Research Tool (RiverSMART) is a
software tool to facilitate
the creation, execution and archiving of planning studies that compare
the
results of several scenarios with differing supplies (hydrologic
scenarios),
demands, and alternative options and strategies such as operating
policies and
infrastructure alternatives. It manages the execution of the
simulations to
multiple processors, and keeps track of the output files for analysis.
It can
serve as an archiving structure to save the results of an entire study.
The
software was designed and developed to address the needs of complex
modeling
studies such as the Basin Studies conducted by the U.S. Bureau of
Reclamation to explore
options
for meeting projected imbalances of future supplies and demands due to
changing
climate and water uses.
RiverSMART development was
funded through Reclamation’s
WaterSMART Grants to Develop Climate Analysis Tools. It was developed
at
CU-CADSWES during the period that Reclamation was working on the
Colorado River
Basin Study and several of the features were directly influenced by
needs
identified by that study.
In addition to RiverWare, some of the other
tools included in RiverSMART such as the Graphical Policy Analysis Tool
and the Demand Input Tool were developed in part under other
Reclamation
contracts and grants and further enhanced and adapted to fit into this
software package. Other components such as the Hydrology Simulator were
developed fully under the WaterSMART grant. RiverSMART can be
further
enhanced to include other plugins; we expect future development based
on needs
of users.
Overview
RiverSMART has
RiverWare at its core – it
organizes input and output files for RiverWare, manages execution of
RiverWare
with multiple run management, and post-processes rdf (RiverWare Data
File)
formatted output files. The main components or
“events” of RiverSMART are:
Hydrology Simulator -
generates an ensemble of hydrologic
traces at an annual timestep based on reference data and a selection of
one of several available
algorithms. Along
with this are the Spatial Disaggregation and Temporal Disaggregation Plugins
that
disaggregate annual single-site data to monthly, multi-site data.
Model
Plugin -specifies a RiverWare model which is used
in scenarios.
Policy
Plugin -specifies a RiverWare policy ruleset and optional
global function sets which are used in scenarios.
DMI (Data Management Interface) Plugin - allows any arbitrary
input of data into the model either as a single series to be imported
before
the multiple runs are executed or trace-based, i.e., run as an
ensemble. For
example, the outputs of the Hydrology Simulator or Demand Input Tool
are input to RiverWare
via the
DMI Plugin.
DMI
(Data Management Interface) Sequence Plugin - specifies a
sequence of DMIs, such as
initial conditions, which are used in scenarios.
MRM (Multiple Run Management) Plugin -
The RiverWare model
can support a number of Multiple Run Management configurations – these
are
named in the Model file. Each MRM configuration event names a
configuration
that will be used in the study. The combination of DMIs, models,
policies and
MRM configurations are selected according to the user’s needs in the
Scenario
Organizer dialog.
Run
Range Event Plugin - specifies a sequence of
run ranges (start date, number of timesteps) for scenarios.
RiverWare – specifies
the RiverWare executable to use for
the study.
RDF
Annualizer –
annualizes monthly rdf output data.
RDF to Excel –
converts the rdf output data to an excel
workbook.
GPAT –
(Graphical Policy Analysis Tool) – generates
graphs that have been pre-configured in an Excel output file.
R Plugin – allows
RiverSMART to call a user-created script in the R programming language
for post-processing of study results.
CSV Combiner –
combines CSV output files into a single CSV file.
Distributed
Simulation Packages
RiverSMART
contains a utility known as "Distributed
Simulation Packages" that
allows subsets of scenarios from a single study to be simulated on
multiple computers or virtual machines in a cloud computing environment
to increase parallelization and reduce overall study time. A "Master
Study" is used to divide the scenarios in the study into "Simulation
Package Files." These package files are then transferred to "Simulation
Computers" where RiverSMART is run in a simulate-only mode. Results
files are then combined in the Master Study for post-processing.
Information on Distributed Simulation Packages can be accessed HERE.
Starting
a Study
When
starting a new study, the study must be given a name and the
directory (Study Folder) must be chosen where the study and all of its
sub-directories
will be written.

Environment variables can be used in the Study Folder path. If
environment variables are used, they must be preceded by a $.
The File menu has items for saving the study, opening an existing
study, and exiting RiverSMART.

The
menu bar has a Help menu with a RiverSMART Help item that will open
this help file from RiverSMART.

The  icon in the
toolbar located below the menu bar will also open the RiverSMART
help file.
icon in the
toolbar located below the menu bar will also open the RiverSMART
help file.
Note that individual help is available for each
event from its configuration
dialog as discussed in the Events section below.
RiverSMART
Workspace
The RiverSMART workspace is populated with events, files, and links to
create a study. These building blocks of a study are discussed below.
Events
Events are added to the workspace by right-clicking the
workspace where you want the event, clicking Add Event, and then
choosing the desired event to add to the study.

When an event is added to the workspace, it is shown as an icon
representing the event type. The event types can be categorized based
on their function in the study. Following are the currently available
events by category along with their icons and a brief description.
Hydrology Events
 Hydrology Simulator - takes observed streamflows and
synthesizes an ensemble of flow data for a specified number of traces
Hydrology Simulator - takes observed streamflows and
synthesizes an ensemble of flow data for a specified number of traces
 Spatial Disaggregation - takes an ensemble of flow
data for a single site and disaggregates it to a number of sites
Spatial Disaggregation - takes an ensemble of flow
data for a single site and disaggregates it to a number of sites
 Temporal
Disaggregation - takes an ensemble of annual flow data for a site and
temporally disaggregates it to an ensemble of monthly flow data
Temporal
Disaggregation - takes an ensemble of annual flow data for a site and
temporally disaggregates it to an ensemble of monthly flow data
RiverWare Input Events
 RiverWare DMI - specifies data to import into a RiverWare
model
RiverWare DMI - specifies data to import into a RiverWare
model
 RiverWare DMI Sequence - specifies a series of DMIs, such as
initial conditions, that are used in RiverSMART scenarios.
RiverWare DMI Sequence - specifies a series of DMIs, such as
initial conditions, that are used in RiverSMART scenarios.
 RiverWare MRM - specifies a Multiple Run Management
configuration from a RiverWare model
RiverWare MRM - specifies a Multiple Run Management
configuration from a RiverWare model
 RiverWare Model - specifies a RiverWare model file
 RiverWare Policy - specifies a RiverWare policy set to use
with a RiverWare model
RiverWare Policy - specifies a RiverWare policy set to use
with a RiverWare model
 RiverWare Run Range - configure scenarios to have different
run ranges
RiverWare Run Range - configure scenarios to have different
run ranges
RiverWare Event
 RiverWare - specifies a RiverWare executable to use for the
study
RiverWare - specifies a RiverWare executable to use for the
study
Post-Processing Events
 RDF Annualizer - takes a RiverWare Data File (RDF) of
timestep less than a year and aggregates the data to an annual RDF file
RDF Annualizer - takes a RiverWare Data File (RDF) of
timestep less than a year and aggregates the data to an annual RDF file
 RDF To Excel - takes a RiverWare Data File and converts it
into an Excel workbook
RDF To Excel - takes a RiverWare Data File and converts it
into an Excel workbook
 or
or  GPAT Graphs
(input by Scenario or Scenario Set) - takes Excel files with series
data from RiverWare and generates graphs in an Excel workbook
GPAT Graphs
(input by Scenario or Scenario Set) - takes Excel files with series
data from RiverWare and generates graphs in an Excel workbook
 or
or  R Plugin (input by Scenario or Scenario Set) - calls a user created
script in the R programming language to post-process study results
R Plugin (input by Scenario or Scenario Set) - calls a user created
script in the R programming language to post-process study results
 CSV Combiner - takes CSV files from a set of
scenarios and combines them to a single CSV file
CSV Combiner - takes CSV files from a set of
scenarios and combines them to a single CSV file
Double-clicking an event's icon will open a configuration dialog for
the event. Note that configuring events and files is mutually exclusive
of generating, simulating, and post-processing scenarios; if dialogs
for processing scenarios in these ways are open, configuration dialogs
for event and files cannot be opened. Following is an example
configuration dialog for a RiverWare DMI event:

The Name field at the top is common to all of the event configuration
dialogs. This name must be unique among all events in the study, and a
unique name is automatically generated when an event is created. The
user can replace the automatic name with a more descriptive one. The
event name is displayed on the workspace as a label directly below the
icon for the event, so the name should be descriptive as a label, but
not overly long. As discussed elsewhere, this name will be used as a
directory name by RiverSMART when managing files related to
the event.
Also common to all event configuration dialogs is the Help item in the
menu bar. This allows the user to access a help file that explains the
configuration options for this event. Each event type has its own help
information to assist the user in filling out the configuration dialog.
One field worth noting that is specific to the DMI
configuration dialog is the Category field. This user-created category
name allows the user to group together DMIs based on the type of data
being imported (i.e. Supply, Demand, Evaporation, etc.). The category
is used as an input type when generating alternative RiverWare scenarios as discussed in a
later section.
Sometimes in a study the choice is not between inputs of a given type
(e.g. between Demands: High and Low) but rather between having an input
or not (e.g. between Supplemental Flow A or No Supplemental Flow). For
these cases, RiverSMART allows the use of a Placeholder event for any
input event type (DMI, MRM, Policy or Model). An event can be
designated as a placeholder event by selecting Placeholder from the
Edit menu in the event configuration dialog.

If an event is designated as a Placeholder event, all of its
configuration options are disabled with the exceptions of the Name
field and the Category field for DMI events. The Placeholder event will
be treated as any other input event in its category when generating scenario combinations.
When the scenarios are executed, however, the event will do nothing.
For example, a Placeholder DMI event will not invoke any DMI for its
category when a scenario containing the Placeholder DMI event is
simulated.
An event can be deleted from the workspace by right-clicking on the
event and selecting the Delete Event option or with the Delete key..

Files
File
items are added to the study to specify file names for outputs from
events, and when linked to a following event will specify an input file
name for that event. Files
are added to the workspace by right-clicking the workspace where you
want the file, clicking Add File, and then choosing the type of file
to add to the study.

When
a file is added to the workspace, it is shown as an icon representing
the file type. There are currently four file types available in
RiverSMART:
 RiverWare Data File - ASCII file representing slot data from
RiverWare, typically output to capture data from all traces of
a
multiple run
RiverWare Data File - ASCII file representing slot data from
RiverWare, typically output to capture data from all traces of
a
multiple run
 Excel Workbook File - Excel workbook,
which could be
an output from the RDF To Excel event, or input or output to a GPAT
Graphs event
Excel Workbook File - Excel workbook,
which could be
an output from the RDF To Excel event, or input or output to a GPAT
Graphs event
 CSV File - Comma Separated Values file
representing
slot data from RiverWare, typically output to capture data from all
traces of a multiple run
CSV File - Comma Separated Values file
representing
slot data from RiverWare, typically output to capture data from all
traces of a multiple run
 netCDF File - Network Common Data Form file representing slot
data from RiverWare, typically output to capture data from all traces
of a multiple run
netCDF File - Network Common Data Form file representing slot
data from RiverWare, typically output to capture data from all traces
of a multiple run
Double-clicking the file icon will open a configuration dialog for the
file.

Files
do not have to have unique names and are given a default label of the
file type (i.e. RDF or Excel Workbook) beneath the icon on the
workspace. They can be given a descriptive name in the Name field of
the configuration dialog, which will then be used as the label on the
workspace. The actual file name is either typed into the text box or
chosen from the pull down menu. The menu lists all of the files of that
type that are found in the model's MRM output configurations. Note, the
actual path to a particular instance of this file is determined by
RiverSMART when it is processing a scenario, you do not enter the full
path, just the name.
A file is deleted from the study by right-clicking its icon and
selecting the Delete File item or with the Delete key.

Linking
Links
are created on the workspace to represent how information will flow
between events and files. In some cases, an event is linked directly to
another event, but in cases where the event output is preserved as a
file, the event is linked to a file item, which then can be linked to a
following event. Hydrology events link directly to each other,
RiverWare input events link directly to RiverWare, and Post-Processing
events link through file items. Links have an arrow to show the
direction the link represents.
A
link is created by right-clicking an icon for the event or file and
clicking the Link item. This shows a cascading menu containing
a
Begin Link item and also a list of possible destinations for the link.

If
one of the possible destinations is clicked, the link is automatically
created between the starting item and the clicked destination item.
Beneath the covers, each event or file has a type and knows what types
it is allowed to link to, both for input and output. It also knows the
number of inputs and outputs allowed for each type. This
information permits the list of available destinations for a link to be
determined for populating the link dialog list.
An alternative
linking approach is to click the Begin Link item in the cascading menu.
This creates a black rubber-banded line that is attached to the
starting item. Moving the mouse over other events or files in the study
makes the line turn green if that is a legitimate destination or red if
it is not. Right-clicking over a legitimate destination brings up a
menu where Create Link can be clicked to complete the link.

A link is deleted by right-clicking on its line and choosing Delete
Link or with the delete key.

Adding
Text
Text
can be added to the workspace to identify like items that may be
grouped together or to add other additional information. Text
is
added by right-clicking the desired location on the workspace and
selecting the Add Text item. This creates a text edit box for typing in
the desired information. When finished typing, clicking outside the
edit box will close it and leave just the text on the workspace. Single
clicking text will select its text box and allow it to be dragged to a
different location. Double clicking text will allow editing of the text
in the text box. Right-clicking text will bring up a Delete Text
context menu for removing the text or the Delete key can be used.
The size and color of text can be modified with controls in
the toolbar on the workspace.

One
or more existing text items can be selected, and their color and font
size can then be modified by the toolbar controls. Any new text added
to
the workspace will have the font size and color currently selected in
the controls.
Multiple Selection
Multiple selections (multiple events, files and text items) can be
selected by dragging out a rectangle:
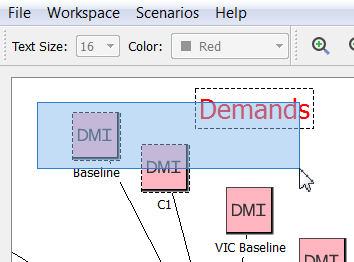
Multiple
selections can also be made by left mouse clicking on an event, file or
text item to begin the selection and then control-left mouse clicking
on events, files and text items to add them to or remove them from
the selection. Right-click menu items apply to the selection.
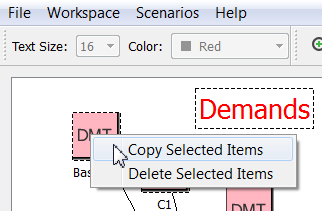
Copy and Paste
The
selected events, files and text items can be copied to the system
clipboard, and the events, files and text items in the system clipboard
can be pasted into the current study. The spatial relationships between
the selected items are preserved as are the links between selected
events and files. The selected items are copied to the system clipboard
by right-clicking on a selected item and choosing Copy. (The wording of
the Copy option will vary depending on the selected items.)
The items
in the system clipboard are pasted into the current study by
right-clicking on the workspace and choosing one of the Paste options:
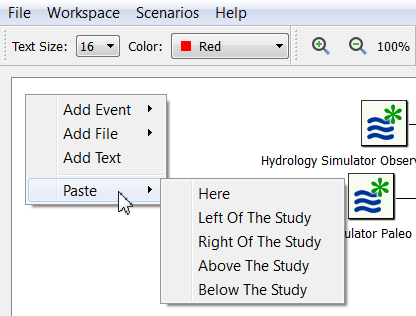
The paste options behave as follows:
| Here |
The items are pasted at the current mouse
position
(the current mouse position is the upper-left corner of the pasted
items) |
| Left of the Study |
The items are pasted centered on the left border of the
study |
| Right of the Study |
The items are pasted centered on the right border of
the study |
| Above the Study |
The items are pasted centered on the top border of the
study |
| Below the Study |
The items are pasted centered on the bottom border of
the study |
The pasted events, files and text items remain as the current
selection, making it easy to "fine tune" their placement.
The
selected items can also be copied to, and pasted from, applications
which support copying and pasting text (for example, text editors and
email clients).
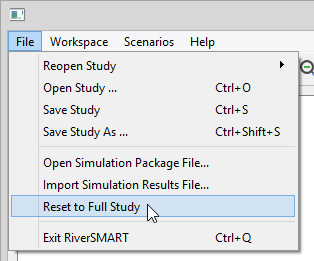
File Menu
The
File menu in the RiverSMART menu bar contains menu items to
open and
save study files. Of particular note is the Reopen Study menu, which
shows the 6 most recently accessed study files and directories.
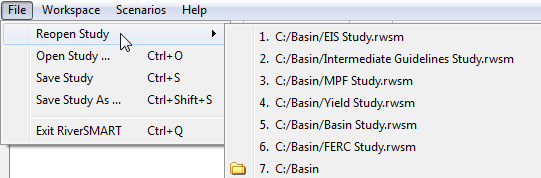
The
files and directories can be selected with the mouse or by entering
their number. Selecting a file opens the study file, selecting a
directory opens the file chooser in the directory.
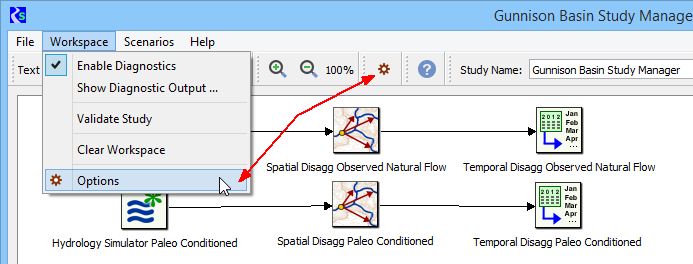
Workspace
Menu
The Workspace
menu in the RiverSMART menu bar contains menu items for
controlling the collection and display of diagnostic messages, for
validating the configurations of the events and files in the workspace,
and for clearing the workspace.

Diagnostic messages are displayed in the Diagnostic Output dialog.

Diagnostic messages are color coded as to whether they are
informational, warning or error messages. The File and Edit menus contain menu items to save diagnostic
messages to a file, to copy diagnostic messages to the system clipboard
and to clear the diagnostic messages.


The Validate Study menu item validates the configurations of
the
events and files shown on the workspace. Validation varies
with
the event or file, but generally includes checking that required
configuration information is provided and verifying that referenced
files that should already exist are available and readable. Validation
messages are displayed in the Validation Output dialog.

Validation
messages are color coded as for diagnostic messages. The File and Edit
menus provide the same menu items as for the Diagnostic Output dialog.
The Column menu item hides or shows the Type column.

The Clear Workspace menu item will remove all events, files, links and
text
from the workspace to present a clean slate.
Zooming
the Workspace
Controls on the toolbar allow the workspace to be zoomed in or
out by increments of 10% within the range of 10% to 400 %. The current
zoomed percent of the workspace is displayed adjacent to the controls.

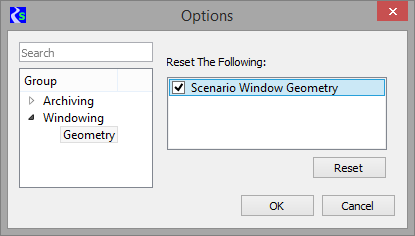
Scenario Window Geometry
The
four scenario dialogs - confirmation, organization,
simulation and post-processing - remember their location and size so
that they always open in the same place and at the same size. This
geometry persists across RiverSMART sessions. To reset the window
geometry back to the default, use the Workspace and then Options
menu. Select the Windowing and then Geometry setting. Select the
Scenario Window Geometry check box and then use the Reset button to set
these back to the default.
Status
Bar
Finally, near the bottom of the workspace, there is a status
bar. As shown, the status bar has four elements:
1. The study status (blue background),
for example “Executing event RiverWare”.
2. The event status (green background),
for example “Simulating scenario C Inflow 2, E Inflow2, R Inflow1, T
Vs, CRSS Policy 2”.
3. The event progress bar: If an event is able to provide a percent complete then the progress bar
shows the percent complete; otherwise is functions as a busy indicator.
4. The diagnostic window button: The
diagnostic window button is a tristate button. In its normal state it
displays a “log file” icon. If warnings have been posted to the
diagnostic window which haven’t been viewed, it changes to the warning
color and blinks (warning state). Similarly, if errors have been posted
to the diagnostic window which haven’t been viewed, it changes to the
error color and blinks (error state). Thus it provides a graphical
indication of whether there are warning or error messages which users
haven’t viewed. It should be noted that “haven’t been viewed” means
that users haven’t opened the diagnostic window from the RiverSMART
user interface since the messages were posted. Users might have to
scroll
the diagnostic window to actually view the messages. Thus,
it is a graphical indication that there are messages users may want to
view.

Example
Configured Workspace
The following shows an example configured workspace with
events, files and links.

The example study shows two sets of hydrology events that are linked in
the upper right portion of the workspace. RiverWare inputs are all
linked to RiverWare in the left part of the dialog (note that DMIs are
grouped into Demands, Supplies, and Evap). Only one RiverWare event is
allowed in a study. RDF files coming out of RiverWare are
post-processed through a series of events and files in the right side
of the workspace to end up with GPAT graphs in Excel
workbooks.
Approaches
for Setting Up RiverWare Inputs
When
configuring a study, users must consider what to configure in the
RiverWare model versus what to configure as inputs in RiverSMART. This
is particularly true for MRM and DMI configurations.
MRM
configurations in RiverWare can specify initialization and per-trace
DMIs as well as policy. A user could create a RiverSMART event
for
a RiverWare MRM configuration that has these specified and and
not
show the DMIs and policy as events on the RiverSMART workspace.
However, this hides the scenario components so that
they cannot be seen in RiverSMART. The RiverWare model has to be opened
to to see the DMIs and the policy that are used. This reduces the
usefulness of
RiverSMART for visualizing how inputs are combined into scenarios. A
more transparent approach would be to have DMI and policy
events
in RiverSMART that will get paired with an MRM configuration event.
The DMIs and policy configured in the RiverSMART events will get
substituted into that MRM configuration n RiverWare to create the
scenario. In
this setup, the RiverSMART workspace provides a visual representation
of how the scenario components are combined into scenarios.
As an
example of DMI configuration trade offs, take the four demand DMIs in
the above example. These may be Excel Direct Connect DMIs where the
data for each demand is contained on a different worksheet in
an
Excel workbook. One approach is to set up four fully configured DMIs in
RiverWare and have the four DMI events in RiverSMART configured to
refer to each RiverWare DMI by name. To set up the
four fully
configured DMIs in RiverWare, much of the DMI configuration needs to be
repeated four times. The actual Excel dataset configurations that
specify the same Excel workbook, but each with a different worksheet,
would be largely repeated, but more importantly, the slots into which
the demand data will be imported need to be repeated in the setup of
each DMI. This may be hundreds of slots and keeping the slot
selections with their begin dates, end dates, and units consistent
across all of the DMIs would be tedious and error prone. Here is an
example of the RiverWare configuration of an Excel direct connect DMI
with slot selections:

A
better approach would be to create one dataset and one DMI in
RiverWare that functions as a template for RiverSMART to fill in for
each scenario. The Excel dataset configuration would refer to the Excel
workbook, but would leave the Single Run Name (the worksheet name)
blank:

The
one DMI in RiverWare would use this "template" dataset, and would
contain the slot selections as shown above. The four RiverSMART DMI
events would have configurations that refer to that one RiverWare DMI,
but would provide the worksheet name that will be substituted into the
"template" dataset for that particular demand:

In
this way, only one dataset and DMI need to be maintained in RiverWare.
RiverSMART can use these as a template and substitute in the correct
worksheet for each demand as configured in its DMI events.
A disadvantage of using a template DMI is that the demand
DMIs
cannot be run interactively from within RiverWare itself
without
manually inserting the missing information into the template or using a
script to do this.
Hydrology
Processing
The hydrology-related
plugins link to each other, but not to other types of events. Their
purpose is to create traces of hydrology data that can be moved into
RiverWare via a separately configured RiverWare DMI event. Generating
hydrologies can be very time-consuming and, once configured properly,
these events would not typically be rerun unless some input data has
changed.
Execution of hydrology events are initiated via the
context menu. Right-clicking a hydrology event will bring up the
following menu.

The
execution options allow the user to execute the selected event, execute
all previous linked events up to and including the selected event, or
to execute all events after the selected event. These options give a
lot of flexibility for executing all or parts of a linked hydrology
sequence so that only the pieces that need to can be rerun.
The
location of generated hydrology results is controlled by RiverSMART.
Under the specified Study Folder for the study, a Hydrology
directory is created. Each event that generates hydrology data will
have a directory created under the Hydrology directory named with the
event's name. Trace folders are then created under the event's folder
with the generated data files for each trace.
There is also a
Working directory created under the Study Folder. A subdirectory is
created here for each event that will contain information like log
files or intermediate results generated during the event's execution.
These can be useful for debugging problems in event execution.
The R Project for Statistical Computing along with some of its
component packages must be installed on the user's computer for the
hydrology events to execute successfully. The following steps describe
how to install R and its packages:
- Download R for Windows
- Navigate to http://cran.r-project.org/
- Select "Download R for Windows"
- Select "base"
- This takes you to the download page for the current R
version. The RiverSMART plugins were developed and tested with
version 2.14.2, but they should work with later versions. If necessary,
versions older that the current one can be downloaded by clicking the
"Previous Releases" link and selecting an older version.
- Save the download file to your computer.
- As administrator, run the download file to install R on
your system. The default installation directory and other options are
fine.
- Add the R executable location to your computer's "Path"
environment variable.
- As administrator, go to Computer, Properties, Advanced
System Settings, and click Environment Variables.
- Under the System Variables section, highlight "Path" and
click Edit.
- Add a semicolon to the end of the variable's value and then
append the path to the directory containing your desired R executable,
for example "C:\Program Files\R\R-2.14.2\bin\x64".
- Click Ok to save the edit
- Install packages needed by R scripts in RiverSMART
- Start R as an administrator by
right-clicking its desktop icon and using that menu item.
- In the R menu bar click on Packages, then Install
Package(s)…
- You may be asked to select a mirror site from which to
download packages.
- You will get a list of available packages. Select the
following packages from the list and then click OK:
- zoo
- reshape
- ggplot2
- msm
- e1071
- gplots
- The packages should then be downloaded and installed for
you.
- Exit the R interface.
Scenario
Processing
A
scenario refers to a particular combination of RiverWare inputs, which
create a RiverWare run. The generation, simulation and
post-processing of RiverWare scenarios are controlled from the
Scenarios menu in RiverSMART. Note that these menus are disabled if
configuration dialogs are open for files or events on the workspace;
the configuration and the running of scenarios are mutually exclusive.

Generate
Scenarios
The
Scenario List Organizer dialog that is accessed from the Generate
Scenarios item in the Scenarios menu in RiverSMART is where all
of the potential combinations of the inputs linked
into RiverWare
are made into scenarios. An example follows:

A
column is created for each of the RiverWare input categories. Note that
the
RiverWare DMIs have been assigned one of three different category names
in their configuration dialogs, so the three categories show up as
separate columns in this dialog (Supply, Demand, and Evap). By default
the columns show up in alphabetical order but can be selected and
dragged to move them into an order which makes the most sense to the
user for identifying the scenarios. This is important because the order
of the columns here determines the scenario name, which is a
concatenation of the column names from left to right. There is an
additional dialog available from the Edit menu that can further modify
scenario names.

The
Scenario Name Configuration dialog presents controls to select which
columns should become components of the name and what the separator
between the components should be.

In
this example, the same MRM Configuration and Model are used for all
scenarios, so including these in the name adds no additional
information for differentiating among scenarios. These are unchecked to
leave them out of the name. The separator for the components of the
name is selected via the combo box. An example of a scenario name as
configured is given at the bottom of the dialog.
Once set in
the Scenario List Organizer dialog, the scenario name cannot be changed
without coming back to this dialog to regenerate the scenarios, which
will cause the loss of any simulation and post-processing state
information previously associated with the scenarios. Scenario names
are fixed in this way because directories for files generated by
RiverSMART are automatically created using the scenario names as
directory names.
You can see at the bottom of the Scenario List
Organizer that 48 scenarios have been created from the combination of
inputs to RiverWare in the example. Not all of these make sense
because, for example, VIC Evap should only be used with VIC supplies.
In reality there are only twelve scenarios among the 48 that should be
run for this model. To eliminate the unwanted combinations from
cluttering up this and subsequent dialogs, the unwanted scenarios can
be checked and deactivated. Checking is accomplished by using the Check
drop down menu at the top of the dialog.

All
will check every row (a shortcut for this is to check the box to the
left of the menu, which will also check all rows). None will uncheck
any checked rows. Selected allows you to check any rows that you have
selected in the dialog. Since there may be many rows in this dialog
with the need to check many individual rows, this approach allows you
to incrementally select and check things as you work through the list.
Once unwanted scenarios are checked, they can be deactivated from the
edit menu.

When
a scenario is deactivated, that state is persistent across all dialogs.
The scenario will not show up in any of the other dialogs in
RiverSMART. If scenarios are mistakenly deactivated, the Activate
Inactive Scenarios menu item will bring them all back and the correct
ones can then be checked and deactivated.
There is also
functionality to hide and show scenarios. Hiding simply hides scenarios
from view in this dialog only and does not deactivate them. This is
accomplished by checking scenarios and using the Hide Checked Scenarios
item under the View menu.

The
Show Hidden Scenarios menu item will bring back all hidden scenarios
into the dialog view. Note that the message line at the bottom of the
dialog says how many active scenarios there are, how many are hidden
and how many are currently checked.
Simulate
Scenarios
The Scenario List Simulator dialog is accessed from the
Simulate
Scenarios item in the Scenarios menu in RiverSMART.
This is a two level tree-view that lists the activated scenarios with
sub-items for activities that have been completed during simulation for
each scenario. Checking
a scenario and clicking the Simulate Checked Scenarios menu item will
initiate a RiverWare MRM run utilizing that scenario's inputs. Note
that the MRM run are typically set up as distributed runs. If they are
not set up to be distributed, then are automatically converted into
distributed runs using the default number of processors on the machine.
If more
than one scenario is checked in the Scenario List Simulator, each will
run sequentially until all are
completed. If scenarios are being run, the Stop Simulations menu
item will be active. Clicking this allows the current scenario to
finish, but will stop execution before the following scenario
starts.

The
location of scenario simulation results is controlled by RiverSMART.
Under the specified Study Folder,
a directory named Scenario is created. Under here a directory
is
created for each scenario using the scenario's name. The files
generated by RiverWare (i.e RDF, CSV, and netCDF) from simulating a
scenario go into this
folder. There is also a
Working directory created by RiverSMART under the Study Folder.
A subdirectory is
created here with the RiverWare event's name that contains a directory
for each scenario. This is where log
files or intermediate results generated during simulation of the
scenario are placed.
These can be useful for debugging problems.
When the RiverWare MRM configuration is set up to distribute
individual runs of a multiple run across cores on the computer, the
distributed MRM interface will be displayed during a scenario's
simulation. This
shows the progress of the traces distributed to each core and the
status of the current individual trace running on each core. The Stop
All button on the interface can be used
to interrupt a currently running scenario.

If
a scenario's simulation was successful, the icon in the run column of
the Scenario List Simulator dialog will turn from gray to
green.
An unsuccessful simulation will make the icon red. When a scenario is
selected in the dialog, the
status line near the bottom will show the status information for that
scenario. This state
information of success or failure of simulations is saved with the
study and persists if the study is closed and reopened. The
Mark
Checked Scenarios As Simulated and Mark Checked Scenarios As Not
Simulated menu items allow manual control over whether the run icon is
gray or green. For instance if a scenario is successfully simulated,
but the study was not saved after that, the icon could appear
gray when the study is reopened even though the scenario has been
simulated. The icon could then be made green manually to reflect the
true state of the scenario. The yellow file folder button at the end of
a
scenario line will generate a Windows Explorer dialog open to
the
Scenario directory where output files for that scenario reside.
If
the scenario's tree is opened,
the activities for a simulated scenario are shown. An activity
represents a step in completing the scenario simulation, such as
initializing the model, executing the distributed MRM controller, or
simulating traces. The
activity status is shown as a green check for success and a red check
for failure. Note that an activity may fail, but the icon for the
scenario could still show green. It is advisable to open the activity
list for a simulated scenario to check the activities for problems.
Highlighting
an activity line will give a status message for the activity at the
bottom of the dialog. If RiverWare created a log file associated with
the activity, the file icon in the status message will be enabled and
will open the log file for viewing. This link can aid in identifying a
problem if the RiverWare activity was unsuccessful.
When
a scenario is simulated, keyword/value descriptors are created to
characterize the scenario and its input events. These descriptors are
written to the MRM configuration in the RiverWare distributed model as
MRM
descriptors and from there are optionally available as outputs to CSV
and netCDF files from the multiple run. Descriptor
keyword/value
pairs are created as follows:
- The scenario name: Scenario/(scenario name)
- RiverWare Policy event: Policy/(event name)
- RiverWare Model event: Model/(event name)
- RiverWare DMI event: (DMI category)/(event name)
- RiverWare MRM event: MRM Config/(event name)
- Also included are user-created keyword/value pairs from the
RiverWare MRM event interface
The Scenario List Simulator dialog also
contains menu items to deactivate/activate scenarios under the Edit
menu and hide/show scenarios under the View menu. These work as
described above for the Scenario List Organizer dialog. Deactivated
scenarios apply across all dialogs in RiverSMART. Hidden
scenarios apply to this dialog only (if a large number of scenarios
have been
successfully run, for example, you may want to hide them to reduce
dialog clutter).
Post-Process
Scenarios
The Scenario List Post-Processor dialog is accessed from the
Simulate
Scenarios item in the Scenarios menu in RiverSMART.
This is a three level tree-view that lists the activated scenarios
followed by the events performed via post-processing followed by any
completed activities for an event. Checking
one or more scenarios and one or more files and then clicking the
Post-Process Checked Scenarios
menu item will
initiate their post-processing. When a scenario is post-processed, its
output files (i.e. RDF or CSV) are run through the linked processes
that follow each output
file icon on the RiverSMART workspace. Post-processing typically
might involve taking an RDF file and running it through events like the
RDF Annualizer and/or RDF to Excel to generate Excel workbooks that can
then be used for data analysis. Files resulting from post-processing
are managed by RiverSMART and are placed where the scenario's output
files
reside, under the Scenario directory of the study under a
subdirectory with the scenario name. Log files or intermediate results
from post-processing go in the Working directory of the study
under a subdirectory with the event name. If scenarios are
post-processing, the Stop Post-Processes menu
item will be active. Clicking this allows the current scenario to
finish processing, but will stop before the following scenario
starts.
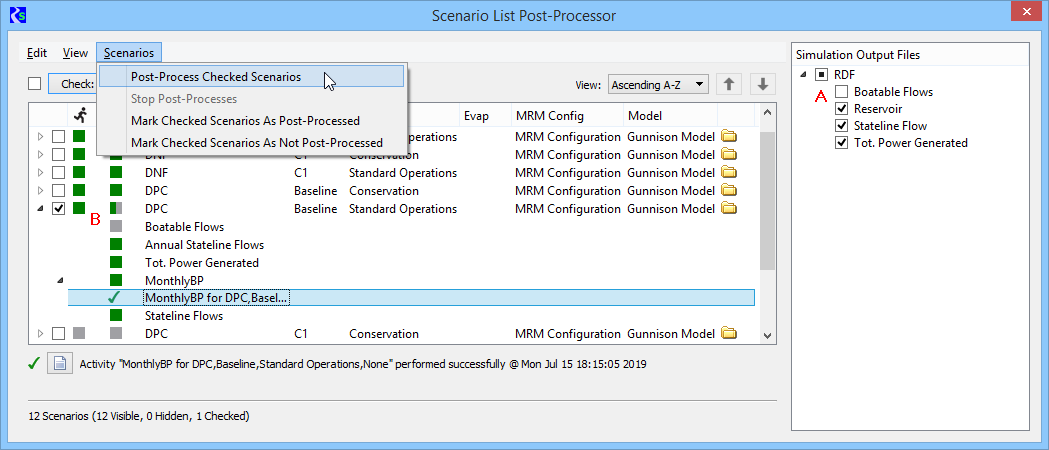
The above dialog shows that:
- The "Boatable Flows" RDF file is not selected for
post-processing.
- The
"Boatable Flows" RDF file was skipped when the checked scenario was
post-processed and consequently the scenario is partially
post-processed (as indicated by the half green / half gray icon).
For convenience, the simulation status of scenarios is shown with icons
in the run column of the Scenario List Post-Processor (green for
successful, red for unsuccessful, gray for not run). The next column of
icons is the post-processing status. For a scenario, the
post-processing status can be green for all successfully run, red for
all failed, part red and part green for some steps successful and some
failed, and gray for not processed. The Mark
Checked Scenarios As Post-Processed and Mark Checked Scenarios As Not
Post-Processed menu items allow for some manual control over the
post-processing icon for a scenario (in case the study was not
saved to properly record the status after some
post-processing). The yellow file folder button at the end of a
scenario line will generate a Windows Explorer dialog open to the
Scenario directory where output files for that scenario reside.
If
the scenario's tree is opened,
the post-processing status is marked for each event in the
post-processing of the scenario, green for success and red for failure.
If an event line is highlighted, a status message for the
post-processing of that event is displayed at the bottom of the dialog.
If unsuccessful, the reported error message is given in a second line
of the status message. If an event reports individual
activities in its post-processing, these appear as another
sublevel in the tree view under the event, with a green check meaning
success and a red check meaning failure of the activity. Highlighting
an activity line will give a status message for the activity at the
bottom of the dialog. An activity can create a log file with
information about what transpired in the activity. If a log file is
available, the file icon in the status message will be enabled and will
open the log file for viewing. Following is a sample log file generated
by GPAT for the
successful Stateline Flow Graphs activity highlighted in the above
dialog:

This Scenario List Post-Processor dialog also
contains menu items to deactivate/activate scenarios under the Edit
menu and hide/show scenarios under the View menu. These work as
described above for the Scenario List Organizer dialog. Deactivated
scenarios apply across all dialogs in RiverSMART. Hidden
scenarios apply to this dialog only (if a large number of scenarios
have been
successfully post-processed, for example, you may want to hide them to
reduce
dialog clutter).
Archive
Scenarios
Scenario
outputs (RDF, CSV, NetCDF, Excel and R Script output files)
can be
archived as ZIP files in an archive directory. Archiving can be used to
conserve disk space or to facilitate sharing outputs. Archiving is
configured in the Options dialog, which is accessed from the menu item
or toolbar button:
The Archive Options page enables users to configure when and how
scenarios are archived:
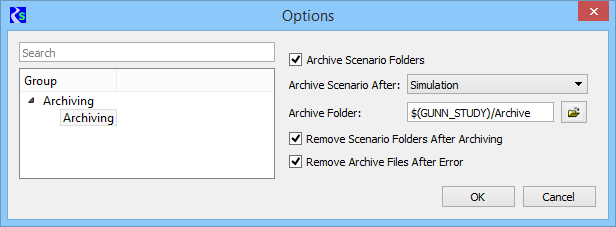
Archive Scenario Folders
The
checkbox indicates whether scenarios are to be archived. If checked the
other controls are enabled, if unchecked the other controls are cleared
and disabled. The default is unchecked.
Archive Scenario After
The
combo box controls when scenarios are archived, either after successful
simulation or successful post-rrocessing. (Scenarios aren't archived
following errors.) The default is after simulation.
Archive Folder
The
archive folder path is specified either by typing it into the
edit field or with the directory chooser button. The path can contain
environment variables. No default is provided, users; users must
specify the path.
Remove Scenario Folders
After Archiving
The
checkbox indicates whether scenario folders should be removed after the
scenario has been archived. The default is unchecked.
Remove Archive Files
After Error
The
checkbox indicates whether archived scenarios should be removed after
an error. Suppose a scenario is simulated successfully and archived,
then re-simulated unsuccessfully. Depending on why scenarios are being
archived, the archived scenario could be thought of as not reflecting
the current state of the scenario, in which case it should be removed.
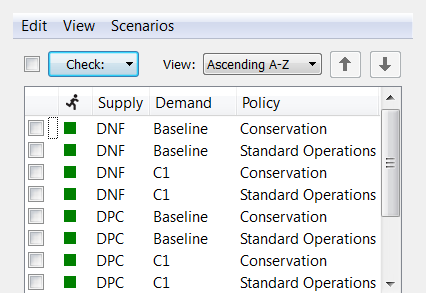
Display Orders
When
generating, simulating or post-processing scenarios the order of the
scenarios is determined by the order of the RiverWare inputs, with the
leftmost input changing least frequently and the rightmost input
changing most frequently. By default the order is ascending:
The View menu:
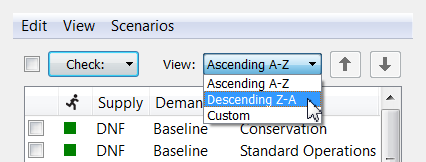
allows for the scenarios to be displayed in descending order:
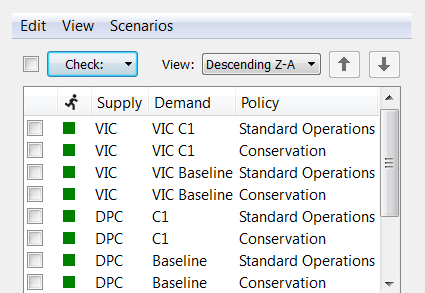
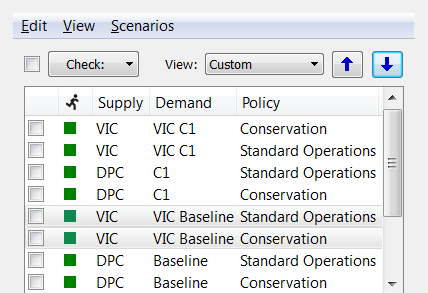
and custom order (controlled by the up and down arrows, which move the
selected scenarios up and down one row at a time):
Updating
Scenario Inputs
When
modifications are made to input events (DMI, MRM, Model or Policy),
RiverSMART provides visual
indicators to alert you to portions of the study that are no longer
up-to-date. If any item, other than the name, in the configuration
dialog for an input event is modified, the
label of the event will turn red to indicate that scenarios that
include the
event need to be regenerated.

It
is also possible to manually specify that an event has been modified.
For example, if one or more rules in a ruleset gets modified, this
could change the outputs for scenarios that include the ruleset;
however
RiverSMART is not aware of any changes made to external files, such as
a ruleset or data files. In
order to transmit the information that the ruleset has been modified,
and thus its associated scenarios are out-of-date, the Externally
Modified option
can be manually selected from the Edit menu of the event configuration
dialog.

Selecting
Externally Modified will have the same effect as modifying the event
configuration. The event label will turn red, and RiverSMART will be
aware that scenarios that include the event need to be regenerated. If
a new input event is added to the study, its label will
also be red indicating that scenarios should be regenerated to
incorporate the new event.
As a further indicator that scenarios
might be out-of-date, in the Scenario List Simulator and Scenario List
Post-Processor dialogs, any scenario that contains an event that has
been modified will be colored red. This again indicates that scenarios
should be regenerated, and these scenarios should be re-run to bring
study results up-to-date. Scenarios that were unaffected by changes to
input events will remain black.

Note
that the icon in the run status column is still green, indicating that
the scenario has been successfully simulated. This is because scenarios
have not yet been regenerated, and thus the scenario has simulated
successfully based on the current scenario inputs.
The next step
is to regenerate scenarios in order to update all scenarios that have
had input events modified. Select Regenerate Scenarios from the
Scenario menu in the RiverSMART menu bar.

Selecting Regenerate Scenarios will bring up the Scenario Confirmation
dialog.
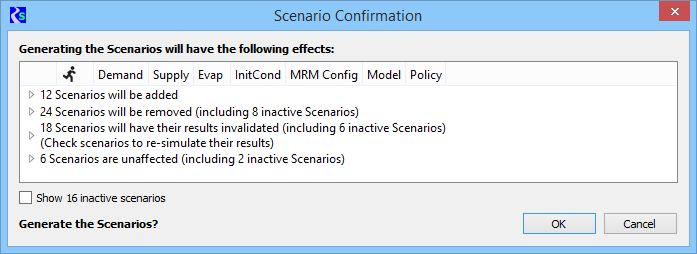
The
Scenario Confirmation dialog indicates scenarios that will be added,
will be removed, will have their results invalidated or will be
unaffected based on any modifications made to input events since the
last time scenarios were generated. Clicking on the arrow next to the
row for a given category will expand the row to show all of the
individual scenarios that apply.
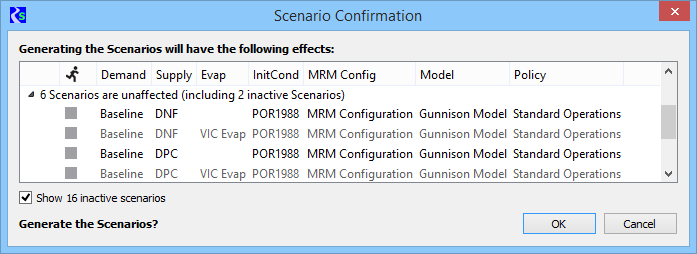
If
a category contains inactive scenarios the category's description
includes the number of inactive scenarios in the category. The "Show
inactive scenarios" check box controls whether inactive scenarios are
displayed. If they are, they're shown grayed-out:
The
dialog contains quite a bit of information to assist in making an
informed decision about whether to regenerate the scenarios.
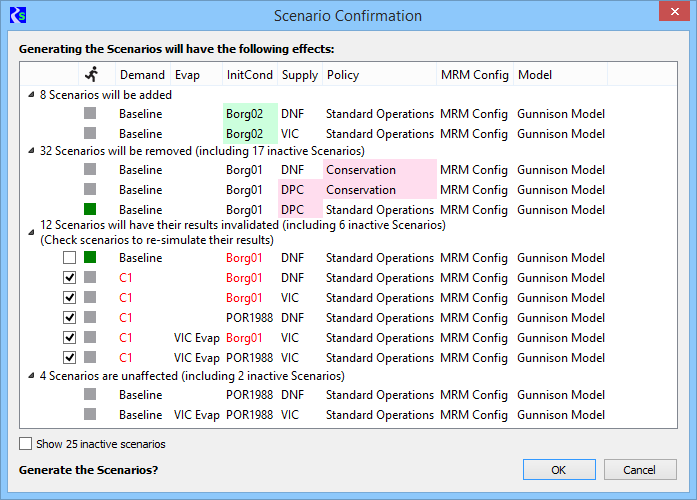
(Scenarios
have been edited from the screen capture for compactness, which is why
the counts don't match the number of scenarios.)
Scenarios
which will be added or removed are highlighted to indicate
why
they're being added or removed. Similarly, scenarios which are out of
date and will have their results invalidated are highlighted to indicate which input events
caused them to be out of date.
The
run status column indicates which scenarios have have been successfully
simulated. Removing these scenarios or invalidating their results could
represent a loss of significant time and effort. The simulation status
informs users of the potential loss.
It's possible to
modify certain input events in ways which add scenarios without
invalidating existing scenarios. For example, in the DMI Sequence event
extending the sequence adds scenarios without invalidating existing
scenarios. However, because of how RiverSMART generates scenarios it's
unable to recognize the distinction and includes the existing
scenarios with those whose results will be invalidated. In this example
the "InitCond" DMI sequence event was modified to add scenarios with
initial condition "Borg02", which caused scenarios with initial
condition "Borg01" to be out of date. The user is able to leave unchecked the
boxes next to the "Baseline / Borg01" scenarios to preserve their
results. Those that are not checked, will preserve their results,
thereby eliminating the need to re-simulate them.. Note that you
would check the boxes next to the "C1" scenarios, as
they're also out of date because the "C1" demand was modified.
Clicking OK will regenerate scenarios.
At this point, all options described in the Generate Scenarios section can be re-applied. Once scenarios are regenerated,
all event
labels will return to black, and the scenario names in the Simulator
List Simulator and Scenario List Post-Processor dialogs will return to
black. Any scenarios that had their results invalidated when
scenarios
were regenerated (or any new scenarios added) will now display a gray
box in the run status column indicating that the scenario has not yet
been run (needs to be resimulated). Scenarios that were unaffected will
continue to display the
run status they displayed before regenerating scenarios.

At
this point, the scenarios with a gray box can be resimulated and
post-processed. Scenarios with a green box do not need to be
resimulated because their results were not affected by the changes to
the input events.j
Scenario
Set Definition and Processing
Scenario Sets are precisely that, a number of scenarios that have been
grouped together into a set. The reason for creating scenario sets is
to facilitate analyzing and comparing results across scenarios. With
many scenarios in the study, it may be impractical, for example, to
graph desired output data for all scenarios on a single plot because it
gets too cluttered. Scenario sets can be created to group scenarios
that you do want to compare together. For example a set could be
created for all scenarios that have the same hydrology but different
demands and policies. Or scenarios with a certain policy, but differing
demand and hydrologies could be grouped into a set. The following
sections discuss defining and processing scenario sets.
Definition
Scenario sets are defined in the Scenario Set Manager, available from
the Scenario Set Management menu item under the Scenarios menu of
RiverSMART.

The Scenario Set Manager dialog shows scenario sets that have been
defined, in the left panel. When a set is selected on the left,
Scenario Sets panel, the scenarios that are members of the selected set
are shown in the right panel. Following are operations performed on the
left panel:
- Add a new, empty set with a default name using the
Add button.
- Rename the selected set by
double-clicking the name.
- Delete the selected set using the
Delete button.
The right panel shows a list of scenarios. It has two modes:
- View mode (shown above): In View mode,
only the scenarios that are members of the selected set are shown. You
can investigate and sort the scenarios, but cannot add or remove
scenarios from the set.
- Edit mode (shown below): In Edit mode
all scenarios in the study are shown. Scenarios can be added to, or
removed from, the selected set by checking or unchecking the scenarios
using the Check button.
In both modes, the order of the scenarios is determined as described in
the Display Orders section.

Processing
All of the post-processing as described in an earlier section are by
individual scenarios. Processing involving sets of scenarios is
initiated differently. Where scenario sets are utilized, they are
specified as inputs in the configuration of a particular event. GPAT
Graphs, the R Plugin, and the CSV Combiner are currently
the events where scenario sets can be configured as
input.
Events using scenario sets as input are grouped
by event type and given a Process menu item in the Scenarios menu of
RiverSMART.

The cascading menu under Process GPAT Graphs allows individual
GPAT Graphs events that use scenario sets to be processed, similarly
for Process R Plugin. When a
scenario set is processed, the input file(s) linked to the event is
retrieved for each scenario in the set, and all are passed together to
the event for processing. In the case of GPAT Graphs, the input Excel
files for all scenarios in the set are passed to GPAT where graphs are
generated that contain lines for each scenario to present a visual
comparison of results from the scenarios. The graphs generated for the
scenario set go to an output Excel workbook. The directory
for this result workbook is managed by RiverSMART and
is located in the ScenarioSet directory under the study folder.
Here a directory is created for each scenario set name, with a
subdirectory for
each event that processed the scenario set, which will contain the
result file. In the case of CSV Combiner, the linked CSV files for all
scenarios in the set are passed to the event where they are combined to
a single CSV output file. The use of
linked input files by an R Plugin is dependent on the user-created R
script called by the plugin. Any log
files generated by a GPAT Graphs event, a CSV Combiner event, or R
Plugin event go under the
Working directory of the study folder in a directory with the event's
name.
Directory
Structure
An important aspect of RiverSMART is its ability to manage all
of the files associated with a complex study.
The idea is that all of the files for the study are organized together
in a directory structure so that the study can be easily archived or
moved. The user specifies a Study
Folder directory in the interface
that is the root for all of the directories and files. RiverSMART
automatically creates the following directories under the study
folder:
- Hydrology
- The Hydrology directory will contain a
subdirectory for each hydrology event in the study, named with
the name of the event. (The hydrology event types include Hydrology
Simulator, Spatial Disaggregation, and Temporal Disaggregation.) Under
each subdirectory are the trace directories for the ensemble of data
generated by the event.
- Model - RiverSMART creates this directory but places
nothing in it. This is
where the user should put all of the files that are inputs to the
study, but are not generated by RiverSMART, such as RiverWare
model files, rulesets, input DMI data and control files, hydrology
plugin inputs, GPAT configuration files, and RDF annualizer control
files.
- Scenario
- The Scenario directory will contain a subdirectory for each activated
scenario in the study, named with the name of the scenario. Any result
files generated for the scenario will be placed here, including RDF
files from RiverWare, RDF files from RDF Annualizer, and Excel files
from RDF To Excel.
- ScenarioSet
- The ScenarioSet directory will contain a subdirectory for each
scenario
set that is processed. Under
the scenario set's directory, a subdirectory is created for each event
that processes the scenario set, which will contain the result file(s)
from that
event's processing of that set.
- Working - The Working directory
will contain a subdirectory for each event that was processed in the
study, named with the name of the event. This directory will contain
any log files, XML files, or intermediate result files generated during
processing of that event. This information can be useful in debugging
problems that occurred during processing.
Distributed
Simulation Packages
Table
of Contents
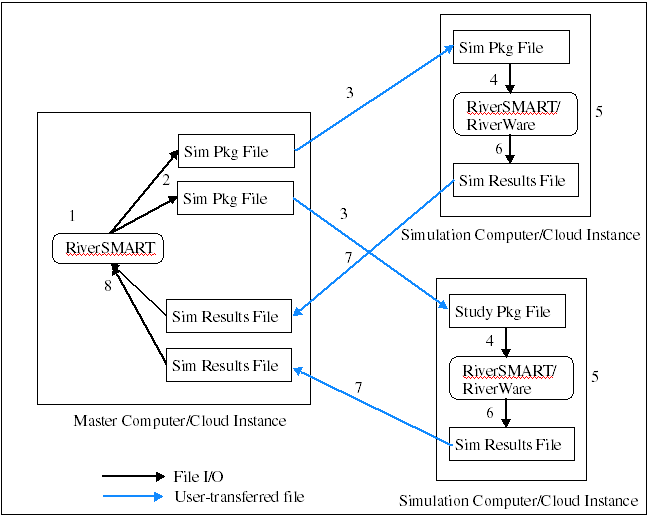
Overview
Simulation
Packages facilitate the distribution of scenarios across multiple
computers. This allows you to run more simulations in parallel,
reducing overall simulation time. The best way to explain the
capability is with a workflow. There is a single “Master Study” which
is used to create “Simulation Package Files.” Each Simulation Package
File is configured to simulation a subset of the scenarios in the
frullThe user distributes the Simulation Package Files to multiple
computers where “Simulation Studies” simulate the scenarios in each
package and then create a “Results Package File.” The Results Packages
are then combined in the Master Study. Simulation Packages can also be
distributed to multiple virtual machines in cloud computing environment.
The Distributed Simulation Packages approach is illustrated in the
schematic diagram below.
The following sections describe the steps to use Distributed Simulation
Packages.
Creating
Simulation Package Files
These steps assume that a standard study has been fully configured in
RiverSMART.
- Open
the desired study in RiverSMART. You will notice that in the bottom
right corner of the workspace it will display "Full Study." This
indicates that the study is currently in standard mode.
- Regenerate
Scenrarios: From the RiverSMART menu bar, select
Scenarios -> Regenerate Scenarios...
It
can be helpful to remove any unnecessary files from the study directory
prior to regenerating scenarios in order to minimize the size of the
Simulation Package Files. However once you have regenerated scenarios,
it is recommended that you do not modify the contents of the study
directory manually so that the necessary directory and file structure
is maintained and so that all required files are present.
- In
the resulting Scenario List Organizer, select the scenarios you want
active, their naming format, etc. just as you would for a standard
study.At this point you are still selecting scenarios for the full
study, not sub-sets for the packages.
- Create
Scenario Sets: From the RiverSMART menu bar,
select Scenarios -> Scenario Set Management...
The
scenario sets you create in this step will be used to define the
Simulation Package Files. There will be one Scenario Set per package.
The Scenario Sets you create for the purpose of defining Simulation
Package Files do not need to correspond to Scenario Sets created for
other purposes in the study, such as post-processing.
- In the Scenario Set Manager, click Add for a new Scenario
Set.
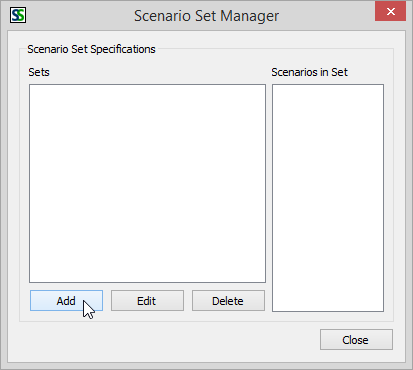
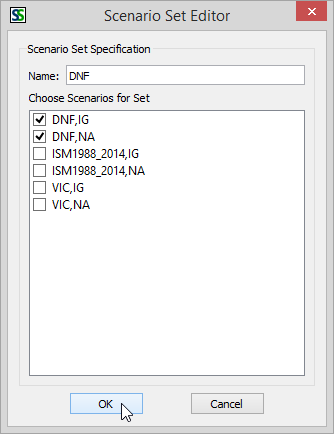
- In
the resulting Scenario Set Editor dialog, give the Scenario Set a name
and check the boxes for the scenarios you want to include in the set.
- Repeat steps 5 and 6 to add as many Scenario Sets as
necessary.
You should add one Scenario Set for each Simulation Package you intend
to create. Ideally, you would want define your Scenario Sets so that
the number of traces for each is relatively balanced in order ot
minimize the overall simulation time (assuming that the simulation
computers all have the same computing capacity.)
- Save your study at this point. Once you save the Simulation
Package
Files, RiverSMART will automatically save the study as a Simulation
Master study; therefore at this point you might want to save a back-up
of your original study with a different name.
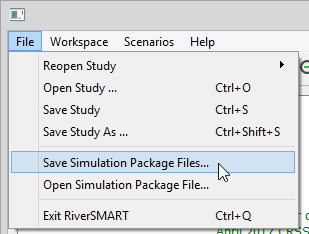
- Save
Simulation Package Files: In the RiverSMART menu bar,
select File -> Save Simulation Package Files...
- Click on the file chooser to navigate to the
folder where you want to save the package files.
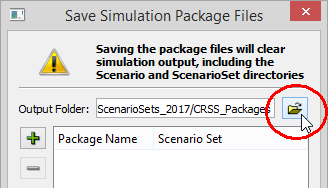
IMPORTANT: You typically do not want to save you package files within the study
directory, especially for large studies. Each time RiverSMART creates a
Simulation Package File, it zips up the entire study directory. If you
save the package files within the study directory, then the first
package file will get included in the second package, and so on, so the
size of each successive package file will grow exponentially.
- Add a Simulation Package by clicking on the green
plus button.
- Double-click
on the default name (e.g. Package000) to give the package the desired
name. This name will get used as the Simulation Study directory name on
the simulation computer.
- Double-click in the area in the Scenario
Set column to activate the Scenario Set menu, and then select the
desired Scenario Set. There can be only one Scenario Set per package.
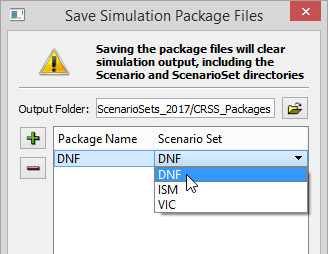
- Repeat steps 11-13 to add as many Simulation
Package files as necessary. Then click Save.
RiverSMART
will create zip files called <Package Name>_pkg.zip (e.g.
DNF_pkg.zip) in the output folder specified. If files with the same
name already exist in that location, they will get overwritten without
a confirmation dialog. The package files will contain the entire study
directory contents (i.e. all of the files necessary to simulate the
scenarios) and an automatically generated study file, <Package
Name>_study.xml, configured for
simulating only the scenarios associated with that package.
IMPORTANT: Two
events occur automatically when you save the Simulation Package Files
that are worth noting:
- Saving
the package files clears any existing simulation output, this includes
any files in the Scenario and ScenarioSet directories.
- RiverSMART
automatically saves the study file in the Simulation Master mode. The
words "Simulation Master" will replace "Full Study" in the bottom right
corner of the workspace. This is the study mode you will use to import
the results files after the simulations have completed. You
can only import results files in the same study in which their
Simulation Package Files were created, so you must be sure to save this
study file in its current state. (i.e. If you select Save As to save the study with a new name, you will
not be able to import the results into that new study.)
You cannot modify the study when it is in Simulation Master mode. If
you want to make changes to the original study while the simulations
are running, you will need to save this study with a new name and then
in that new study select File -> Revert to Full Study. Leave the
original Simulation Master with the original file name as is.
You cannot import a Simulation Results File into a Full Study, only
into the Simulation Master study with which the Simulation Package file
was created.
Opening
Simulation Package Files and Simulating
Once
you have created the Simulation Package Files, you can copy each
package file to a separate simulation computer. The simulation computer
must have the appropriate versions of RiverSMART and RiverWare
installed. After copying the Simulation Pacakge File to a simulation
computer, carry out the following steps on the simulation computer to
simulate the scenarios in the package. These steps should be repeated
for each of the Simulation Packages.
- Create a directory with
the same name as the package. For example, if the package file is
called DNF_pkg.zip, create a directory called DNF. This will become the
study directory for that Simulation Package. The directory must be empty prior
to opening the Simulation Package.
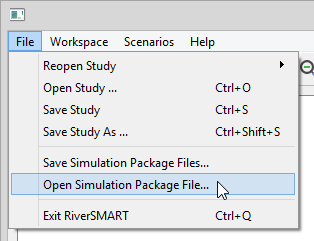
- From the RiverSMART menu bar, select File -> Open
Simulation Package File...
- In
the resulting dialog, click on the file chooser to select the Package
File and the Study Folder (the directory created in step 1). Then click
open
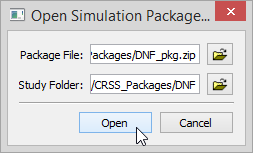
RiverSMART
will unzip the contents of the package into the study directory and
will open the study that was automatically generated for this package.
The words "Simulation Study" along with the package name will appear in
the bottom right corner of the workspace. You will not be able to
modify the study.
Now you will simulate the scenarios as you would in a standard study
- In the RiverSMART menu bar, select
Secarios -> Simulate Scenarios. (Note that the options for
Regenerate Scenarios and Post-process Scenarios are not available.)
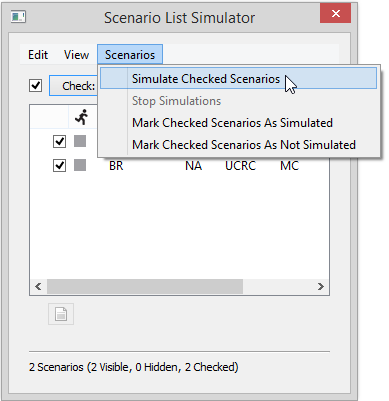
- In
the Scenario List Simulator, check the scenarios you would like to
generate, and then select Scenarios -> Simulate Checked
Scenarios
just as you would in a standard study. Let the simulations run to
completion.
Creating
Results Files
After
the scenarios have completed simulating, the Simulation Results File
can be created. The results file will then be returned to the
Simulation Master study. The following steps should be repeated in each
Simulation Study once the scenarios have completed simulating.
- In the RiverSMART menu bar, select File -> Export
Simulation Results File...
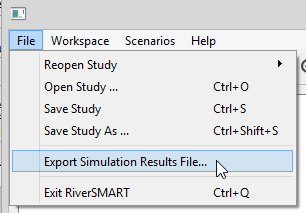
- In
the resulting file chooser, you will specify the folder in which you
want RiverSMART to save the results file. RiverSMART will automatically
name the results file.
RiverSMART will create a zip file,
<Package Name>_res.zip (e.g. DNF_res.zip), in the folder
specified
in step 2. The file contains the Scenario folders with study outputs
along with some working directory files that will be required by the
Simulation Master study.
- Copy the Simulation Results File to the computer with the
Simulation Master study.
Importing
Results Files and Post-processing
After
all of the Simulation Results Files have been returned to the computer
with the Simulation Master study, they can be imported in the
Simulation Master study and post-processed.
- In the Simulation Master study menu bar, select File
-> Import Simulation Results File...
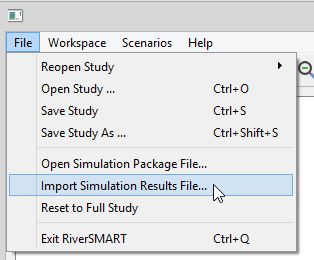
- In the resulting file chooser, select one of the Simulation
Results Files.
- Repeat steps 1 and 2 to import all of the Simulation
Results Files.
- Once
you have imported all of the results files you will need to switch the
study back to a Full Study in order to post-process. In the RiverSMART
menu bar, select File -> Reset to Full Study.
IMPORTANT: You must make sure that you have imported all of the Simulation Results
Files before you reset to Full Study mode. Once the study has been
switched to Full Study mode, you will not be able to import additional
Simulation Results Files.
Once
you have reset to Full Study mode, the text in the bottom right corner
of the workspace will show "Full Study," and you will be able
post-process the results as you would for a standard study by selecting
Scenarios -> Post-process Scenarios.
Hydrology Simulator Plugin Help Information
Table of Contents
Overview
The
Hydrology Simulator will take observed streamflow values and synthesize
an ensemble of flow data for a user specified number of traces. These
trace flow files can then be imported via a DMI to a RiverWare
multiple run. The scripts to generate hydrology ensembles use the R
Project for Statistical Computing program, so R must be installed on
the user's computer (R Installation Instructions).
Available Functions
The Hydrology Simulator has three functions to choose from for generating ensembles:
- Resampled KNN - This function resamples historic streamflow values
using the k-Nearest Neighbor algorithm.
- Paleo Conditioned Homogeneous Markov Chain - This function resamples historic streamflow values
using paleo-reconstructed streamflow sequences. First it creates a transition-probability matrix from the entire paleo
period. Then the historic streamflow
data is divided into 2 or 3 transitional states (based on user
preference). Using these
transition-probabilities as weights, a state is selected for each time step
corresponding to the Trace Length. An
observed streamflow value from the selected state is then chosen using the
k-Nearest Neighbor algorithm. This
process is repeated for each time step until the Trace Length is reached.
- Paleo Conditioned Nonhomogeneous Markov Chain - This function resamples historic streamflow values
using paleo-reconstructed streamflow sequences. First it creates a transition-probability matrix from a
randomly-selected window from the paleo period, of length equal to Trace
Length. This is what differentiates this
method from the Homogeneous Markov Chain method. Then the historic streamflow data is divided
into the same transitional states. Using
these transition-probabilities as weights, a state is selected for each time
step. An observed streamflow value from
the selected state is then chosen using the k-Nearest Neighbor algorithm. This process is repeated for each time step
until the Trace Length is reached.
User Interface
When
the Hydrology Simulator plugin is configured, a user interface is
presented where the user gives the plugin a unique name. Other general
controls are the Help menu item at the top that will bring up this help
file, and the OK button at the bottom that will save the configuration
and dismiss the dialog. The user can select the desired function from a
drop-down list. The following sections discuss the user interface
presented for each function.
Resampled KNN Interface
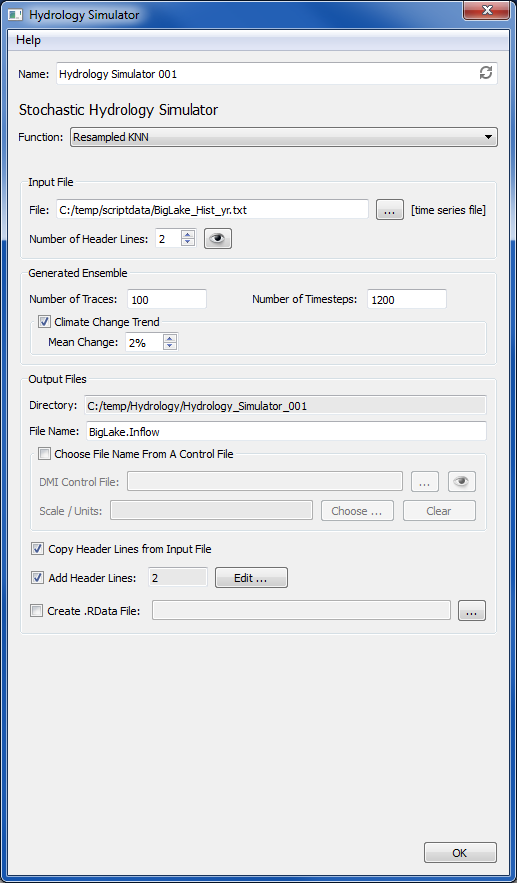
Input File
In
the Input File frame, the user can type in a file name or select a file
via the file chooser button. This file is a single time series of
observed historic flows for the desired site. The R scripts expect that
the file will start with data values, so if there are non-data header
lines in the file, the number of lines to skip needs to be specified by
the user with the Number of Header Lines spin box. The eye icon will
bring up a viewer showing the file (if the file exists) allowing the
user to see what header lines are present.
Generated Ensemble
The
Generated Ensemble frame contains controls to configure ensemble
information. The number of traces to generate in the ensemble and the
number of timesteps to put into each trace are specified here. The
optional Climate Change Trend control allows a positive or negative
percent change to be applied, so that over the course of all the
timesteps in the trace, values will trend up or down by this percent.
Output Files
The Output Files frame contains a number of controls for specifying
output generated by the plugin. The output directory is
determined by RiverSMART and is displayed as read-only here for
information purposes (this directory is named with the name of the
plugin and is located under the Hydrology subdirectory of the study's
directory). A directory for each trace, named trace1, trace2, etc.,
will be created under the output directory. The File Name is the name
that will be given to the resulting output file generated in each trace
directory. This name (typically a site name) can be typed in by the
user, or optionally selected from a RiverWare DMI control file. If this
option is chosen, the DMI Control File name can be typed in or chosen
with a file selector button. The eye icon will allow the user to view
the entire control file. The Choose... button brings up a list of the
slot names present in the control file and the user can select one that
will be populated to the File Name line. If the slot has units
specified in the control file, the Scale/Units line will also be
populated (this is for informational purposes only and has no impact in
changing the ensemble calculations). The Clear button will clear out
entries in the File Name and Scale/Units lines.
The remaining
controls in the Output Files frame are optional checkboxes. The Copy
Header Lines from Input File checkbox allows the user to copy the
header lines identified as present in the Input File over as
header lines to the output files. Add Header Lines allows the user to
type in additional header lines to be put into the output files. The
Edit.. buttons brings up a text box to type in the additional lines,
and when saved, the number of additional lines is displayed in the
adjacent box. The Create R Data File option allows the R session for
generating the ensembles to be saved so that it can be reopened later
in R. The path for the saved file can be typed in or selected with the
file chooser button.
Paleo Conditioned Homogeneous Markov Chain Interface
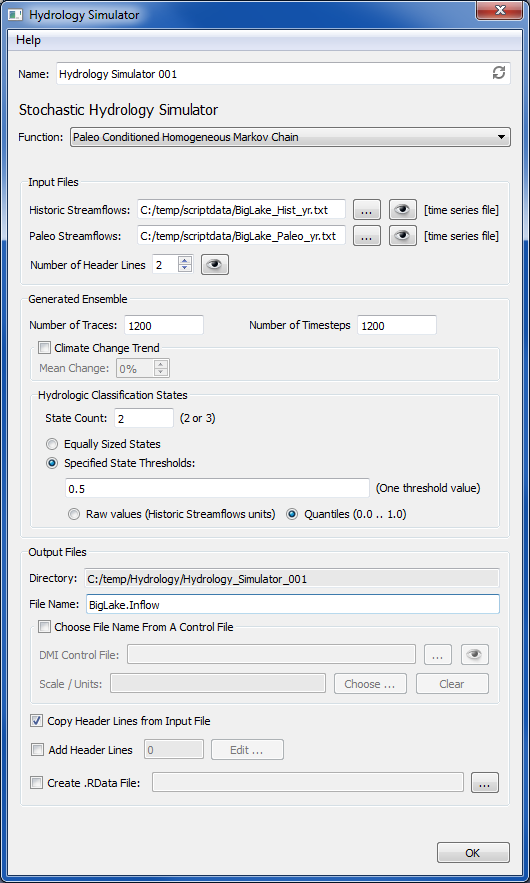
Input Files
In
the Input Files frame, the user can type in file
names for Historic Streamflows and Paleo Streamflows or can
select files via file chooser buttons. Historic Streamflows
are a single time series of observed historic flows for the desired
site. Paleo Streamflows are a single time series of paleo-reconstructed
streamflows for the site. The R scripts
expect that the files will start with data values. If there are
non-data header lines in the Historic Streamflows file, the number of
lines to skip can
be specified by the user with the Number of Header Lines spin box. The
eye icon will bring up a viewer showing this file (if the file exists)
allowing the user to see what header lines are present.
Generated Ensemble
The Generated Ensemble frame contains
controls to configure ensemble information. The number of traces to
generate in the ensemble and the number of timesteps to put into each
trace are specified here. The optional Climate Change Trend control
allows a positive or negative percent change to be applied, so that
over the course of all the timesteps in the trace, values will trend up
or down by this percent.
The
Hydrologic Classification States controls allow definition of the
hydrologic states used in the calculations. The State Count can be 2 or
3 (i.e. corresponding to "dry/wet," or "very dry/normal/very wet" for
classifying the hydrology for each year). Radio buttons allow the given
number of states to be equally sized or have their sizes specified by
entering the separating threshold values in a line widget (comma
separated if there are more than 2 states). Radio buttons allow the
entered threshold values to represent either flow values or quartiles
(from 0.0 to 1.0).
Output Files
The Output Files frame contains a number of
controls for specifying output generated by the plugin. The output
directory is determined by RiverSMART and is displayed as
read-only here for information purposes (this directory is named with
the name of the plugin and is located under the Hydrology subdirectory
of the study's directory). A directory for each trace, named trace1,
trace2, etc., will be created under the output directory. The File
Name is the name that will be given to the resulting output
file generated in each trace directory. This name (typically a site
name) can be typed in by the user, or optionally selected from a
RiverWare DMI control file. If this option is chosen, the DMI Control
File name can be typed in or chosen with a file selector button. The
eye icon will allow the user to view the entire control file. The
Choose... button brings up a list of the slot names present in the
control file and the user can select one that will be populated to the
File Name line. If the slot has units specified in the control file,
the Scale/Units line will also be populated (this is for informational
purposes only and has no impact in changing the ensemble calculations).
The Clear button will clear out entries in the File Name and
Scale/Units lines.
The remaining controls in the Output Files
frame are optional checkboxes. The Copy Header Lines from Input File
checkbox allows the user to copy the header lines identified as present
in the Input File over as header lines to the output files. Add Header
Lines allows the user to type in additional header lines to be put into
the output files. The Edit.. buttons brings up a text box to type in
the additional lines, and when saved, the number of additional lines is
displayed in the adjacent box. The Create R Data File option allows the
R session for generating the ensembles to be saved so that it can be
reopened later in R. The path for the saved file can be typed in or
selected with the file chooser button.
Paleo Conditioned Nonhomogeneous Markov Chain Interface
Interface
controls for the Paleo Conditioned Nonhomogeneous Markov Chain function
are the same as discussed above for the homogeneous function, except
there is an additonal optional checkbox in the Climate Change Trend
controls to Enable Paleo Weighting for the climate change calculation.
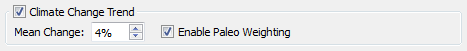
R Installation Instructions
The
R Project for Statistical Computing along with some of its component
packages must be installed on the user's computer for the Hydrology
Simulator to successfully generate ensemble flow data. The following
steps describe how to install R and its packages:
- Download R for Windows
- Navigate to http://cran.r-project.org/
- Select "Download R for Windows"
- Select "base"
- This
takes you to the download page for the current R version. The
RiverSMART plugins were developed and tested with version 2.14.2, but
they should work with later versions. If necessary, versions older that
the current one can be downloaded by clicking the "Previous Releases"
link and selecting an older version.
- Save the download file to your computer.
- As
administrator, run the download file to install R on your system. The
default installation directory and other options are fine.
- Add the R executable location to your computer's "Path" environment variable.
- As administrator, go to Computer, Properties,
Advanced System Settings, and click Environment Variables.
- Under the System Variables section, highlight
"Path" and click Edit.
- Add a semicolon
to the end of the variable's value and then append the path to the directory
containing your desired R executable, for example "C:\Program
Files\R\R-2.14.2\bin\x64".
- Click Ok to save the edit
- Install packages needed by R scripts in RiverSMART
- Start R as an administrator by right-clicking
its desktop icon and using that menu item.
- In the R menu bar click on Packages, then
Install Package(s)…
- You may be asked to select a mirror site from
which to download packages.
- You will get a list of available packages.
Select the following packages from the list and then click OK:
- zoo
- reshape
- ggplot2
- msm
- e1071
- gplots
- The packages should then be downloaded and
installed for you.
- Exit the R interface.
Spatial
Disaggregation Plugin Help Information
Table
of Contents
Overview
The Spatial Disaggregation plugin will take an existing
hydrology ensemble consisting of trace directories each containing a
file of flow data for a single site, and spatially disaggregating that
site's flow data to result in trace directories containing files of
flow data for a number of sites . These trace flow files can then be
imported via a DMI to a RiverWare multiple run. The scripts to
spatially disaggregate flow data use the R Project for Statistical
Computing program, so R must be installed on the user's computer (see R Installation Instructions).
User
Interface
When the Spatial Disaggregation plugin is configured, a user
interface is presented where the user gives the plugin a unique name.
Other general controls in the interface are the Help menu item at the
top that will bring up this help file, and the OK button at the bottom
that will save the configuration and dismiss the dialog. The following
section discusses the spatial disaggregation controls in the interface.

Timestep
Size
This radio button allows the user to specify if the input
ensemble data
discussed below is monthly or annual data.
Input
Traces
In the Input Traces frame, the user specifies information
related to the ensemble of trace data for a site that is being input to
the spatial disaggregation process. If the plugin is linked on the
input side, the directory, number of traces, and flows file name fields
are disabled. In this case, these fields are automatically filled in
when output from the upstream plugin is generated. If the spatial
disaggregation plugin is not linked on the input side, these fields are
enabled and must be filled in by the user. The Directory of
Traces is the directory that contains all of the trace
folders for the input ensemble, and can be typed in or selected via the
directory chooser button. The Number of Traces in the ensemble must be
entered, and the name of the site data file that exists in each trace
directory must be entered in the Flows File Name field. A
site data file should be a single time series flows for the desired
site. The R scripts expect that the file will start with data values,
so if there are non-data header lines in the site data file, the number
of lines to skip needs to be specified by the user with the Number of
Header Lines spin box. The eye icon will bring up a viewer showing a
sample site data file for trace1 (if the file
exists) allowing the user to see what header lines are present.
Pattern
Data
The Pattern Data frame contains the widgets to specify data to
provide a pattern for how to spatially disaggregate the input site. The
Aggregated Flow File is a file containing a single time series of
historical observed values for the input site. The Disaggregated Flows
File is a file containing a column for each site that will be
disaggregated to (values space separated in the row). Each column will
be a time series of historical observed values for that disaggregation
site. These file paths can be typed into the interface or chosen with
the file chooser buttons. The eye icons will bring up a viewer showing
the specifed files. The Location Count box is used to specify the
number of sites to disaggregate to (the number of columns in the
Disaggregated Flows File). The year of the first observation in the
Disaggregated Flows File is entered into the First Year box.
Output
Files
The Output Files frame contains a number of controls for
specifying the output generated by the plugin. The output
directory is determined by RiverSMART and is displayed as
read-only here for information purposes (this directory is named with
the name of the plugin and is located under the Hydrology subdirectory
of the study's directory). A directory for each trace, named
trace1, trace2, etc., will be created under the output directory.
The File Name Mapping controls are used to specify the names
of the output files that will be generated (one name for each site that
is disaggregated to). An entry can be put into the list by clicking the
Add button and then that entry can be edited by double clicking on it
to type in the file name (typically the name of the site).
Alternatively, an entry can be chosen from a DMI Control File. The DMI
Control File name can be typed in or chosen with a file selector
button. The eye icon will allow the user to view the entire control
file. The Add from Control File... button will then bring up a list of
the slot names present in the control file and the user can select one
that will be added to the file name mapping list. If units are specifed
in the control file for the site, the units column in the list will be
populated for informational purposes only. The order of the file names
in the list must match the order of the columns of site data in the
Disaggregated Flows File. The name entrys in the list can be reordered
by selecting and using the up or down arrow buttons under the list.
Selected entries can be removed from the list with the Remove button.
If the number of entries in the list does not match the Location Count
specification, a red warning note above the name mapping list is
displayed.
The remaining controls in the Output Files frame are optional
checkboxes. The Copy Header Lines from Input File checkbox allows the
user to copy the header lines identified as present in the Input Traces
over as header lines to the output files. Add Header Lines allows the
user to type in additional header lines to be put into the output
files. The Edit.. buttons brings up a text box to type in the
additional lines, and when saved, the number of additional lines is
displayed in the adjacent box.
R
Installation Instructions
The R Project for Statistical Computing along with some of its
component packages must be installed on the user's computer for Spatial
Disaggregation to successfully generate ensemble flow data. The
following
steps describe how to install R and its packages:
- Download R for Windows
- Navigate to http://cran.r-project.org/
- Select "Download R for Windows"
- Select "base"
- This takes you to the download page for the current R
version. The RiverSMART plugins were developed and tested with
version 2.14.2, but they should work with later versions. If necessary,
versions older that the current one can be downloaded by clicking the
"Previous Releases" link and selecting an older version.
- Save the download file to your computer.
- As administrator, run the download file to install R on
your system. The default installation directory and other options are
fine.
- Add the R executable location to your computer's "Path"
environment variable.
- As administrator, go to Computer, Properties, Advanced
System Settings, and click Environment Variables.
- Under the System Variables section, highlight "Path" and
click Edit.
- Add a semicolon to the end of the variable's value and then
append the path to the directory containing your desired R executable,
for example "C:\Program Files\R\R-2.14.2\bin\x64".
- Click Ok to save the edit
- Install packages needed by R scripts in RiverSMART
- Start R as an administrator by right-clicking its desktop
icon and using that menu item.
- In the R menu bar click on Packages, then Install
Package(s) ...
- You may be asked to select a mirror site from which to
download packages.
- You will get a list of available packages. Select the
following packages from the list and then click OK:
- zoo
- reshape
- ggplot2
- msm
- e1071
- gplots
- The packages should then be downloaded and installed for
you.
- Exit the R interface.
Temporal
Disaggregation Plugin Help Information
Table
of Contents
Overview
The Temporal Disaggregation plugin will take an existing
hydrology
ensemble consisting of trace directories each containing files
of annual flow data for a number of sites, and temporally disaggrege
the flow data to result in trace directories containing
files of monthly flow data for the sites. These trace monthly flow
files can then be imported via a DMI to a
RiverWare multiple run. The scripts to temporally disaggregate flow
data use the R Project for Statistical Computing program, so R must be
installed on the user's computer (see R
Installation Instructions).
User
Interface
When the Temporal Disaggregation plugin is configured, a user
interface
is presented where the user gives the plugin a unique name. Other
general
controls in the interface are the Help menu item at the top that will
bring up this help file, and the OK button at the bottom that will save
the configuration and dismiss the dialog. The following section
discusses the temporal disaggregation controls in the interface.

Input
Traces
In the Input Traces frame, the user specifies information
related to
the ensemble of trace data for sites that are being input to the
temporal disaggregation process. If the plugin is linked on the input
side, the directory, number of traces, and flows file names list fields
are
disabled. In this case, these fields are automatically filled in when
output from the upstream plugin is generated. If the temporal
disaggregation plugin is not linked on the input side, these fields are
enabled and must be filled in by the user. The Directory of
Traces is the directory that contains all of the trace
folders for the input ensemble, and can be typed in or selected via the
directory chooser button. The Number of Traces in the ensemble must be
entered, and the names of the site data files that exist in each trace
directory must be entered in the Flows File Names list. An entry can be
added to the list with the Add button and then edited by double
clicking on it to type in the name of the file. A selected entry can be
removed from the list with the Remove button. The order of site names
in the list does not matter. A
site data file should be a single time series of flows for a desired
site. The R scripts expect that a file will start with data values,
so if there are non-data header lines in the site data files, the
number
of lines to skip needs to be specified by the user with the Number of
Header Lines spin box. The eye icon will bring up a viewer
showing a sample site data file for trace1 of the first site
(if the file exists) allowing the user to see what header lines are
present.
Pattern
Data
The Pattern Data frame contains the widgets to specify data to
provide a pattern for how to temporally disaggregate the input sites.
The Monthly Flow Directory is a directory containing a file of monthly
flow data for each site in the Flows File Names list. Each file has to
be named with the same site name as in the Flows File Names list.
A file should contain a single time series of monthly historical
observed values starting with January for that input site, and can
contain no header rows. The first year of the monthly flow data needs
to be specified in the First Year box. The optional Annual Flows
Directory is a directory containing a file of annual flow data for
each site in the Flows File Directory. Files in this directory must
also be named with the same site names as in the Flows File Names
list. These files contain a single time series of annual historic
observed data with no header information. If the Annual Flows Directory
option is not selected, the required monthly flow files are aggregated
to get annual values for the calculations. The names of these
directories can either be typed into the interface or chosen with
the adjacent directory chooser buttons.
Output
Files
The Output Files frame contains controls related to the output generated by the plugin. The output
directory is determined by RiverSMART and is displayed as
read-only here for information purposes (this directory is named with
the name of the plugin and is located under the Hydrology subdirectory
of the study's directory). A directory for each trace, named
trace1, trace2, etc., will be created under the output directory.
A monthly flows file for each site is then generated in each trace
directory. The other controls in the Output Files frame are optional
checkboxes. The Copy Header Lines from Input File checkbox allows the
user to copy the header lines identified as present in the Input Traces
over as header lines to the output files. Add Header Lines allows the
user to type in additional header lines to be put into the output
files. The Edit.. buttons brings up a text box to type in the
additional lines, and when saved, the number of additional lines is
displayed in the adjacent box.
R
Installation Instructions
The R Project for Statistical Computing along with some of its
component packages must be installed on the user's computer for
Temporal Disaggregation to successfully generate monthly ensemble flow
data. The
following
steps describe how to install R and its packages:
- Download R for Windows
- Navigate to http://cran.r-project.org/
- Select "Download R for Windows"
- Select "base"
- This takes you to the download page for the current R
version. The RiverSMART plugins were developed and tested with
version 2.14.2, but they should work with later versions. If necessary,
versions older that the current one can be downloaded by clicking the
"Previous Releases" link and selecting an older version.
- Save the download file to your computer.
- As administrator, run the download file to install R on
your system. The default installation directory and other options are
fine.
- Add the R executable location to your computer's "Path"
environment variable.
- As administrator, go to Computer, Properties, Advanced
System Settings, and click Environment Variables.
- Under the System Variables section, highlight "Path" and
click Edit.
- Add a semicolon to the end of the variable's value and then
append the path to the directory containing your desired R executable,
for example "C:\Program Files\R\R-2.14.2\bin\x64".
- Click Ok to save the edit
- Install packages needed by R scripts in RiverSMART
- Start R as an administrator by right-clicking its desktop
icon and using that menu item.
- In the R menu bar click on Packages, then Install
Package(s) ...
- You may be asked to select a mirror site from which to
download packages.
- You will get a list of available packages. Select the
following packages from the list and then click OK:
- zoo
- reshape
- ggplot2
- msm
- e1071
- gplots
- The packages should then be downloaded and installed for
you.
- Exit the R interface.
RiverWare
DMI Plugin Help Information
Table
of Contents
Overview
The RiverWare DMI plugin allows the user to specify
configuration information that is applied to a DMI in
a RiverWare model. DMI is an acronym for Data Management Interface and
represents a mechanism for importing data to a RiverWare model. Linking
this plugin to the RiverWare plugin in the RiverSMART workspace will
result in this DMI configuration being included as a variable in the
development of RiverWare
scenarios. The DMI configurations made in the plugin will be passed to
RiverWare before RiverWare execution and are used to modify the DMI in the model for that RiverWare invocation.
User
Interface
When the RiverWare DMI plugin is configured, a user
interface is presented where the user gives the plugin a unique name.
Other general controls are the Help menu item at the top that will
bring up this help file, and the OK button at the bottom that will save
the configuration and dismiss the dialog. A screenshot of the DMI
interface follows:
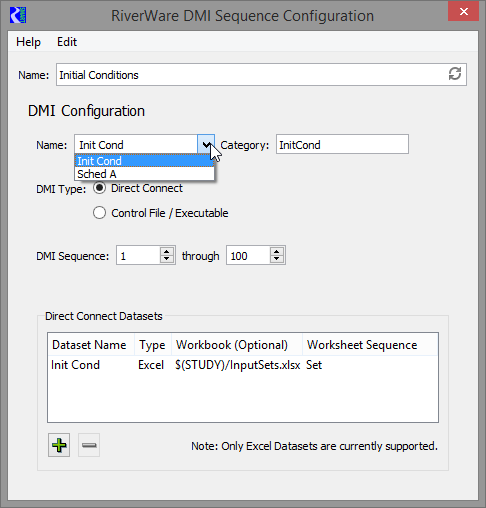
Under DMI Configuration, there is a Name and a Category field. The Name is the name of the DMI in the corresponding
RiverWare model. Select the name of a DMI in the RiverWare model. The pull-down menu lists the DMIs defined in the model that have that DMI Type. The Category is a user-defined category name. This serves as a
way to group together DMI plugin instances on the RiverSMART
workspace that import similar data (for instance Supply, Demand, etc.).
This Category name is used when developing RiverWare scenarios, such
that all Supply DMIs would be considered as alternative choices for a
dimension named Supply when inputs to the RiverWare plugin are combined
into alternative scenarios.
There are three types of DMIs that can be configured in the
interface, selectable via the DMI Type radio button. The interfaces
differ for these types and are discussed separately below.
Direct
Connect DMI Interface
The interface presented when the user has clicked the Direct Connect
radio button under DMI Type is as follows:

The Execution Time radio buttons specify when the DMI should
be executed within the invocation of RiverWare. Pre-run
(Initialization) DMIs are executed once before the multiple run is
started. Per Trace DMIs are run at the beginning of each trace
(run) of the multiple run. If Per Trace is selected, the Trace Count
box must be populated with the number of traces (runs) that the user
wants in the multiple run. This number will be incorporated into the
multiple run configuration to control the number of runs when RiverWare
is invoked.
The Direct Connect Datasets list can be populated by the user
to change some configuration items for datasets specified for this
existing DMI in the RiverWare model. Note that only Excel datasets
are currently
supported by the plugin, and that the configurations that can be
changed for a dataset are the configured workbook, or in the case
of Pre-Run execution, the configured worksheet. The plus button
will add an entry to the list
and the minus button will remove a selected entry from the list. When
an entry is added, a Dataset Name must be entered by double clicking on
this column. The dataset name must match exactly the name of a
dataset configured for the DMI in the RiverWare model. The Type
column will be automatically
populated with "Excel". The Workbook column can then optionally be
double
clicked and populated with the path and name of an Excel workbook that
should be used as inputwhen the DMI is invoked instead of the one configured in the dataset. Similarly, if applicable, a
worksheet name can be entered in the Sheet column to tell the dataset
what sheet to use when invoked.
Control
File DMI Interface
The interface presented when the user has clicked the Control
File / Executable radio button under DMI Type is as follows:

The Execution Time radio buttons specify when the DMI should
be executed
within the invocation of RiverWare. Pre-run (Initialization)
DMIs are executed once before the multiple run is started. Per Trace
DMIs are run at the beginning of
each trace (run) of the multiple run. If Per Trace is selected, the
Trace Count box must be populated with the number of traces (runs) that
the user wants in the multiple run. This number will be incorporated
into the multiple run configuration to control the number of runs when
RiverWare is invoked.
A different executable than the one configured for the DMI in the
model can be specified by entering its path and name in
theExecutable
field or by selecting it via the file chooser button. This is the
executable that will then be invoked when the existing DMI in the model
is run. Executables are
typically developed by users to do certain data-related tasks. In the
example, the executable is a Perl script that copies trace data to a
certain location.
The Argument List is a text box where arguments can be entered (one per
line) that will be passed to the DMI's executable when the DMI
is run. In the example, a trace directory is being passed to tell the
DMI executable named CopyTraces.pl where to find the traces it will be
copying.
Trace Directory DMI Interface
The interface presented when the user has clicked the Trace Directory radio button under DMI Type is as follows:

The Execution Time radio buttons specify when the DMI should
be executed
within the invocation of RiverWare. Pre-run (Initialization)
DMIs are executed once before the multiple run is started. Per Trace
DMIs are run at the beginning of
each trace (run) of the multiple run. If Per Trace is selected, the
Trace Count box must be populated with the number of traces (runs) that
the user wants in the multiple run. This number will be incorporated
into the multiple run configuration to control the number of runs when
RiverWare is invoked. Per Trace is the configuration that makes sense for Trace Directory
DMIs (if Pre-Run is selected only the information for trace one will
be imported prior to the multiple run being started).
The Top Directory Containing Traces must be specified by typing the name
in the
field or selecting it via the drectory chooser button. This is the
top-level directory that contains the trace directories that will be
imported. It is assumed that trace directories are labeled trace1,
trace2, etc. Specification of this top-level directory allows RiverWare
to find the trace data without an executable being specified as is
required for the Control File / Executable DMI.
The Control File is specified by typing the file path
and name in the field or selecting the control file via the file
chooser button. This control
file will be used as a basis for RiverWare to create temporary
control files for each trace of the multiple run. The slots to be
imported would be listed along with any keyword pairs,
like units and scale, that can be used with control files in Control File/Executable DMIs. The file keyword and value can be
specified or not for the slots. If specified, the path up to the file
name will be substituted with the path to the appropriate trace
directory when the DMI is run in RiverWare. If no file keyword is used,
RiverWare will insert the trace path with the %o%s file name, meaning
the name of the file is expected to match the object and slot name.
RiverWare
MRM Plugin Help Information
Table
of Contents
Overview
The RiverWare MRM plugin allows the user to specify the name
of a
Multiple Run Management (MRM) configuration that has been set up in a
RiverWare model. Linking this event to the RiverWare event will
result in this MRM configuration being included as a variable in the
development of RiverWare
scenarios. Note that the MRM configuration must specify that runs be distributed to work correctly with RiverSMART.
User
Interface
When the RiverWare MRM event is configured, a
user
interface is presented where the user gives the event a unique name.
Other general controls in the interface are the Help menu item at the
top that will bring up this help file, and the OK button at the bottom
that will save the configuration and dismiss the dialog. The interface
appears as follows:
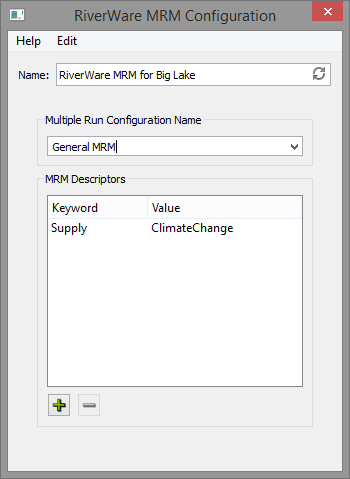
The MRM configuration name can be selected from the pull-down menu, which lists all defined MRM configurations in the specified RiverWare model.
User-defined
MRM deescriptors can be added with the plus button or a selected one
can be deleted with the minus button. The Keyword and Value fields are
editable by double clicking on their fields. These are provided because
an MRM configuration could actually include policies and DMIs that go
together (such as VIC demand, VIC supply, and VIC operations) instead
of having these broken out as separate input events in RiverSMART. In
this case, it may be useful to associate one or more keyword/value
pairs with the configuration to describe the inputs it represents. In
the above example, a DMI in the MRM configuration brings in a hydrology
based on climate change projections, so it is given a descriptor that
the Supply is Climate Change. When a scenario is simulated, these
descriptors are written to the MRM configuration in the RiverWare model
as MRM descriptors and will appear in the Description tab of the MRM
configuration dialog of the model that is running the scenario. MRM
descriptors can optionally be configured to write to CSV and netCDF
files that may be outputs from the multiple run for the scenario.
RiverWare
Model Plugin Help Information
Table
of Contents
Overview
The RiverWare Model plugin allows the user to specify a
RiverWare model file. Linking this plugin to the RiverWare plugin will
result in this model being included in the development of RiverWare
scenarios.
User
Interface
When the RiverWare Model plugin is configured, a
user
interface is presented where the user gives the plugin a unique name.
Other general controls in the interface are the Help menu item at the
top that will bring up this help file, and the OK button at the bottom
that will save the configuration and dismiss the dialog. The interface
appears as follows:.

The model file and its path can be typed into the user
interface or can be selected with the adjacent file chooser button.
RiverWare
Policy Plugin Help Information
Table
of Contents
Overview
The RiverWare Policy plugin allows the user to specify a
RiverWare policy set (RPL Set). Linking this plugin to the RiverWare
plugin will
result in this policy being included in the development of RiverWare
scenarios.
User
Interface
When the RiverWare Policy plugin is configured, a
user
interface is presented where the user gives the plugin a unique name.
Other general controls in the interface are the Help menu item at the
top that will bring up this help file, and the OK button at the bottom
that will save the configuration and dismiss the dialog. The interface
appears as follows:

The RPL Set file path and name can be typed into the interface
or can be selected with the adjacent file chooser button. Any separate
global function sets that are needed for the RPL set should be
specified by using the Add... button to choose the global set and add
it to the Global Function Set list. The text for an entry in the list
can be edited by double clicking on the entry, and selected entries can
be removed with the Remove button.
RiverWare
Run Range Event Help Information
Table
of Contents
Overview
The
RiverWare Run Range Event provides a mechanism to configure a
study in which scenarios have different run ranges (e.g., different
start or end dates). The event configure a series of
run ranges which are used to generate scenarios. In describing the
event it is helpful to use an example, as follows:
For the sample study there are 12 run ranges with a monthly
timestep, beginning with each month from 1980-01 through 1980-12.
The run duration is 24 months, with the exception that the policy
requires that the run ranges extend through at least May of the
end year. In tabular form, there are 12 run ranges:
| Start Date |
End Date |
# Timesteps |
| 1980-01 |
1982-05 |
28 |
| 1980-02 |
1982-05 |
27 |
| 1980-03 |
1982-05 |
26 |
| 1980-04 |
1982-05 |
25 |
| 1980-05 |
1982-05 |
24 |
| 1980-06 |
1982-06 |
24 |
| 1980-07 |
1982-07 |
24 |
| 1980-08 |
1982-08 |
24 |
| 1980-09 |
1982-09 |
24 |
| 1980-10 |
1982-10 |
24 |
| 1980-11 |
1982-11 |
24 |
| 1980-12 |
1982-12 |
24 |
Each of the 12 run ranges is a unique input to the study and is
used to generate scenarios. Continuing with the example, if the study
has 2 RiverWare Policy events, 4 RiverWare DMI events with a Supply
category and 2 RiverWare DMI events with the Demand category, then the
study has 12 x 2 x 4 x 2 = 192 scenarios.
User
Interface
The Run Range Event configuration dialog is shown below with values consistent with the example:

The dialog has a help menu to access this help document. It also provides the event with a unique name
(here "Run Range"). It also has the controls to configure the series of
run ranges, as follows:
| Label |
An optional label which is prepended to the run range's name, either LABEL-YYYY-MM-DD or LABELYYYYMMDD (as determined by the name format). If a study contains multiple run range events whose dates overlap, the label can be used to distinguish the events. |
| Name Format |
The
name format specifies how a run range's start date is formatted to form
the run range's name (which in turn is used to form scenario names).
Although the dialog shows full YYYY-MM-DD precision, only the
precision necessary for the simulation timestep is used (YYYY,
YYYY-MM or YYYY-MM-DD). |
| Timestep |
The simulation timestep (yearly, monthly or daily), which must match the model's simulation timestep. |
| Start Date |
The
start date of the first run range in the series. Only the precision
necessary for the simulation timestep is used (YYYY, YYYY-MM or
YYYY-MM-DD). If
the timestep is yearly or monthly the date is edited by selecting the
year or month and either typing the new value or clicking the up/down
arrows:  .
If the timestep is daily, the date is edited either by selecting the
year, month or day and typing the new value or by clicking the
pull-down menu to open a calendar dialog to select the date: .
If the timestep is daily, the date is edited either by selecting the
year, month or day and typing the new value or by clicking the
pull-down menu to open a calendar dialog to select the date:  . . |
| Duration |
The
duration of each run range in the series. For a yearly timestep the
duration is specified in years, for a monthly timestep
it's specified in years or months and for a daily timestep
it's specified in years, months or days. |
| Start Date Increment |
The
offset added to the start date of each run range in the series to
determine the start date of the next run range in the series. For a
yearly timestep, the increment is specified in years. For a monthly
timestep, it is specified in years or months. For a daily
timestep, it is specified in years, months or days. |
| Number of Runs |
The number of run ranges in the series. |
| R Language Script |
An optional R Language script which can adjust the run ranges for policy specific requirements (described in detail below). |
For daily timestep durations or start date increments specified in years or months, the results might have unintended offsets.
For example, if the start date is 1980-01-31 and the start date
increment is 1 month, the start dates of the first few run ranges in
the series will be (assuming a non-leap year) 1980-01-31, 1980-02-28
and 1980-03-28, not the last day of each month (as might have been
intended).
R Language Script
In the example, the policy requires that run ranges extend through at least May of the
end year, which means that the run ranges beginning in January through
April have durations greater than 24 months. This type of policy
specific behavior ca not be captured in this configuration; instead the Run Range Event
enables you to provide an R language script file which can adjust the run
ranges as necessary. The R language script file must define the function:
adjustDates <- function(inputFile, outputFile)
{
}
The inputFile and outputFile parameters are the full paths to the function's input and output files,
described below. Other aspects of the function are also described
below. The workflow is:
- The event generates the run ranges from its configuration. The run ranges adhere to the duration and start date increment.
- The event writes the run ranges to a CSV file (whose format is described below).
- The event invokes Rscript.exe to execute the adjustDates() function. The function's inputFile parameter is the full path to the file written in step 2, its outputFile parameter is the full path to a file which the function is expected to write.
- Rscript.exe
must be installed and in the user's search path. The RiverSMART
distribution contains instructions for installing R script.
- If
RiverSMART diagnostics are enabled the input and output file paths are displayed in
diagnostic messages, which may be helpful in debugging the R script.
- The adjustDates() function parses its input file, adjusts
the run ranges as necessary, and writes its output file - a CSV file
whose format is identical to that of its input file.
- If
the function determines that no adjustments are necessary, it should not write an output file (indicating no change).
- If
the function finishes successfully (including no change) it should exit
with a zero status; otherwise it should exit with a non-zero status.
- If the adjustDates() function
finished successfully, and if it wrote its output file, the event
parses the file and validates the adjusted run ranges contained in the
file. If the adjusted run ranges are valid, the event replaces the run
ranges it generated with the adjusted run ranges.
adjustDates() Function
The
function can print informational messages and error messages which
will be displayed in RiverSMART's diagnostic window. (The information
messages will only be displayed if RiverSMART diagnostics are enabled.)
There are undoubtedly many ways to do this in the R language; one way
to do this is to define the functions:
info <- function(...) cat(sprintf(...), sep='', file=stdout());
error <- function(...) cat(sprintf(...), sep='', file=stderr())
which can be called as one would call the R language sprintf() function.
The function's exit status indicates whether it finished successfully or not:
# Successful:
quit(, 0, )
# Error:
quit(, 1, )
An error exit status should be accompanied by error message(s).
CSV File Format
The adjustDates() function's input and output CSV files contain 10 fields:
- Run number (1 .. N)
- Run name
- Timestep (year, month or day)
- Start year
- Start month
- Start day
- End year
- End month
- End day
- Number of timesteps
The
CSV files contain full precision (yyyy,mm,dd) even if the timestep
doesn't require it. For the example, the first few lines of the
adjustDates() function's input file are:
run_number,run_name,timestep,start_year,start_month,start_day,end_year,end_month,end_day,num_timesteps
1,1980-01,month,1980,01,31,1982,01,31,24
2,1980-02,month,1980,02,29,1982,02,28,24
3,1980-03,month,1980,03,31,1982,03,31,24
Preview
Understanding
the run ranges the Run Range Event generates and how the R language script
adjusts them would be difficult. Users would need to generate the
scenarios and then compare 2 CSV files in the event's working
directory. To address this difficulty the event provides a preview
capability, which executes the workflow described above and presents
the results in the preview dialog. Previewing the example shows the run
ranges extended through May of the end year:
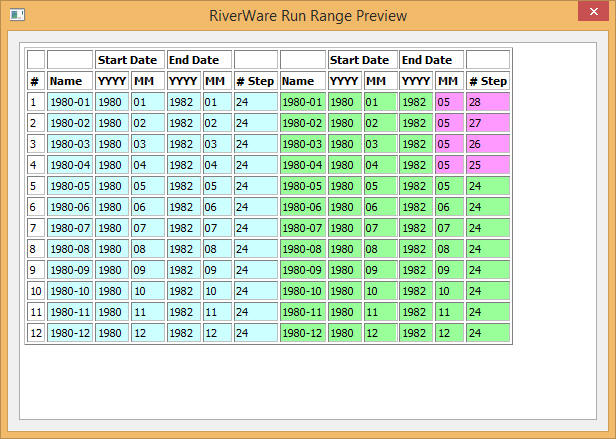
The initially generated run ranges are shown in blue, the adjusted run ranges are shown in green
and the differences are highlighted in violet. The preview capability
makes it easy to understand the run ranges and how the R language
script adjusts them.
DMI
Integration
In some uses of
the Run Range Event, run ranges are associated with DMIs. For
example, the run range 1980-01 might have different initial conditions
than the run range 1980-02. Users would organize their data to include
the run range names, for example, in trace directories:
C:/Study/InitCond/1980-01
C:/Study/InitCond/1980-02
...
Or, alternatively, in an Excel workbook with sheets named "1980-01", "1980-02", ...
To
facilitate configuring the DMI events, DMI event configurations
can include the variable %RunRange%, which is replace with the run
range's name. This shows a Trace Directory DMI using the variable:
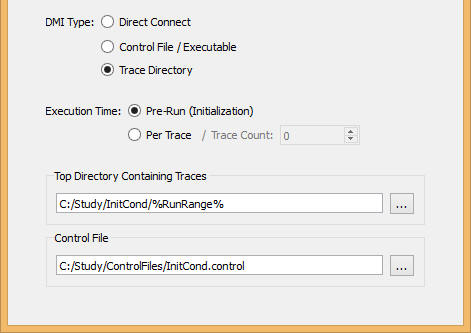
With
this configuration, the scenarios using run range 1980-01 will import
the initial conditions in C:/Study/InitCond/1980-01, the scenarios
using run range 1980-02 will import the initial conditions in
C:/Study/InitCond/1980-02 and so on. The DMI event configuration fields
which support the %RunRange% variable are:
- The Direct Connect DMI's workbook and sheet.
- The Control File / Executable DMI's executable and arguments.
- The Trace Directory DMI's top directory and control file.
RiverWare Plugin
Help Information
Table
of Contents
Overview
The RiverWare plugin allows users to:
- Specify the RiverWare executable that will be used to perform simulations.
- Control whether the simulation status dialog is displayed.
- Add batch script commands to the simulations.
User
Interface
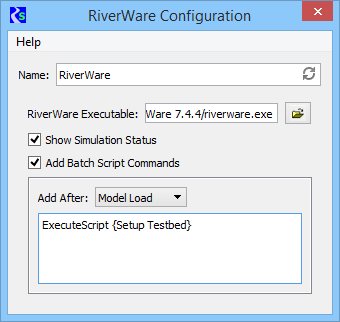
Name
The
plugin name is specified by typing it into the edit field. A default
name is provided; users can provide a more meaningful name.
RiverWare Executable
The
RiverWare executable path is specified either by typing it into the
edit field or with the file chooser button.No default is provided;
users must provide the path.
Show Simulation Status
The checkbox determines whether the simulation status dialog is displayed. The default is checked.
Add Batch Script Commands
The
batch script controls enable users to insert batch script commands into
the RCL script used to configure a model file for a particular scenario.
The
checkbox determines whether commands are inserted into the RCL script.
If checked the other controls are enabled, if unchecked the other
controls are cleared and disabled. The default is unchecked.
The
combo box enables users to select where the commands are inserted,
either after the model file is loaded or after the pre-run DMIs are
invoked. The default is after the model file is loaded.
The edit
field enables users to specify one or more batch script commands. The
commands are inserted into the RCL script "as is" (with blank lines
removed). The commands can include environment variables.
RdfAnnualizer Plugin Help Information
Table
of Contents
Overview
The
RdfAnnualizer plugin will use a RiverWare Data Format (RDF) file with a
timestep of less than a year and will aggregate its data to generate an
RDF file with an annual timestep. Methods for aggregating data for the
slots in the RDF file are specified via a method control file. The user
also
specifies the end month for the aggregated year, so calendar years or
water years can be generated, for example.
Source
RDF File
RDF files are generated from
RiverWare and contain data for slots specified by the user. Non-series
slots can be written to RDF files, but only data for series slots will
be processed by the RdfAnnualizer tool. The exact format of an RDF file
is described in the Output and Plotting section of RiverWare Online
Help. An RDF file for results from a single run in RiverWare can be
created from the Output Manager via a RiverWare Data File device. Slot
data for a multiple run in RiverWare can be output to an RDF file by
configurations in the Output tab of the MRM Configuration dialog.
The source RDF file should contain series data with a timestep of less
than
a year.Currently in RiverWare this would include timesteps of
1
hour, 6 hour, 12 hour, daily, weekly, and monthly. If a yearly timestep
file is specified as input to the RdfAnnualizer, an error message will
be returned that the run is already in an annual timestep.
Method
Control File
The
method control file specifies the slots to be processed and the
annualization method associated with the slots. The file is a text file
and the syntax is for each line to contain an entry of the form:
Object.Slot: Method
where Object can be:
- A specific object name from RiverWare
- a "*" symbol as a wildcard to match any object name
- An object type from RiverWare to match all objects of this
type, such as "LevelPowerReservoir"
where Slot can be:
- A specific slot name from RiverWare
- a "*" symbol as a wildcard to match any slot name
and where Method can be any of the following:
- Sum (adds all of the values for the year)
- Average (average of all the values for the year)
- Max (maximum of all the values for the year)
- Min (minimum of all the values for the year)
- End (last value in the year)
- Begin (first value in the year)
- SumNan
- AverageNan
- MaxNan
- MinNan
- EndNan
- BeginNan
The
behavior of the non-Nan methods is to report NaN for the summary value
if any of the input values for the year are NaN. The Nan suffix on a
method means that NaN input values are ignored in calculating the
summary value.
If the same slot is identified more than once in
the method control file through specific declarations or wildcards, the
method is set at the first identification and not changed thereafter.
Example
Method Control File
An example method control file might contain the following entries:
*.Outflow: Average
*.Pool Elevation: End
Big Reservoir.Evaporation: SumNan
DataObj.*: EndNan
Outflow
for all objects in the file will be averaged over the year and if any
outflows are NaN, the result for the year will be NaN. Pool
Elevation for all abjects in the file will be the last value for the
year and if any values over the year are NaN, the result will be NaN.
For the object named Big Reservoir, its evaporation slot will be summed
over the year, and if any values are NaN, they will be skipped and the
remaining values will be used in the sum. For all objects in the file
that are data objects, all of their slots will be assigned the last
value of the year whether there are any NaNs or not in
the data
over the year.
End
Year Month
The
RdfAnnualizer plugin will take a month specification that becomes the
end of
year for the annualization calculations that generate the result RDF
file. The default is December for annualizing to calendar years, but
any month can be specified, such as September for water years. Another
example would be if you want an RDF file with storage for reservoirs at
the end of March, you could annualize with March as the end month and
use the End method to get the last value for the year.
Note
that if the timesteps in the source RDF file generate partial years at
the beginning or end of the time range when annualized into the defined
year, the partial years are dropped when the result RDF file is
written. The result annual RDF file only contains data for full
annualized years.
Result
Annual RDF File
The result RDF
file contains all of the same descriptive fields as the original source
RDF file, such as name, owner, description, etc., and will contain the
same number of runs. Note that only slots from the original file that
have a method defined in the method control file will be annualized, so
the output RDF file could have fewer slots than the input
file
(also any non-series slots in the source RDF file will not be
annualized). The time_step_unit field is written as year, and the end
times for the specific annualized years are listed as the new timesteps
for the file.
The same slot header information is listed in
the result file for annualized slots, except a method field
is
added to show the specific method for how that slot's data was
annualized. Also, if the method was Sum or SumNan, the units field for
the slot has the phrase "summed over the year" added to it (such as
"acre-ft/month summed over the year"). Otherwise, the result annual RDF
file looks exactly like an RDF file that was output from a RiverWare
model with a yearly timestep.
User
Interface
When
the RdfAnnualizer plugin is activated, the following user interface is
presented (note that the source RDF file and the output annual RDF file
are configured in the program calling the plugin, so are not part of
this interface):
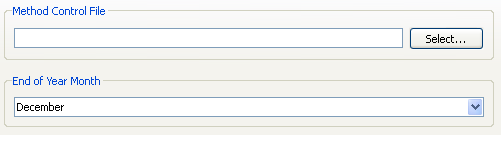
The Method
Control File can be indicated by either
using the associated "Select..." button to open a file chooser dialog,
or by typing in the path and file name into the file's text
field. An
environment variable of the form $NAME, for example, can be typed in
and the NAME environment variable defined on the system would then be
substituted into the Method Control File path when the program is run.
The End of Year Month
is a combo box where the month defining the end of the annualized year
can
be selected by the user.
RdfToExcel Plugin Help Information
Table
Of Contents
Overview
The
RdfToExcel plugin will use a RiverWare Data Format (RDF) file and
convert its contents into an Excel workbook using user-specified
configuration options. This is accomplished, in part, by automating
Excel on the user's computer, so the tool is Windows only, and the user
must have Excel. installed. Since the tool automates whatever version
of Excel the user has installed, the tool is not tied any particular
version of Excel and its associated workbook format or limitations.
RDF
Files
RDF
files are generated from RiverWare and contain data for slots specified
by the user. Non-series slots can be written to RDF files, but only
data for series slots will be processed by the RdfToExcel tool for
writing to Excel. The exact format of an RDF file is described in the
Output and Plotting section of RiverWare Online Help. An RDF file for
results from a single run in RiverWare can be created from the Output
Manager via a RiverWare Data File device. Slot data for a
multiple
run in RiverWare can be output to an RDF file by configurations
in the Output tab of the MRM Configuration dialog.
Excel
Workbook
When
an RDF file is written to an Excel workbook, a Header worksheet is
created followed by sheets containing the slot data. These are
discussed
below along with the available slot name options.
Header
Sheet
The
header sheet contains a summary of
the information in the RDF file that is not slot
data. This includes:
File name
Owner
Description
Creation Date
Number of Runs
Number of Slots
Number of Timesteps
Information for Each Run
Information for Each Slot
Listing of the Timestep Dates
Data
Sheets
The
appearance of the data sheets depends on the workbook orientation
option selected by the user. A workbook has three "dimensions", rows,
columns, and worksheets, that can be mapped to the data dimensions of
timesteps, slots, and runs. Typical orientations would be to put
timesteps as rows, slots as columns, and runs as sheets, or timesteps
as rows, runs as columns, and slots as sheets. In this last
orientation, for example, the first column would contain a timestep
label in each row, the first row would contain a run label in
each column, each sheet would be labeled as a slot, and cells
in
the sheets would contain the corresponding timestep data as
indicated by the header labels and sheet name. Some orientations are
more common, but any of the six possible orientations are available.
Slot
Names
Because
slot names from RiverWare can be very long, fitting them into the
workbook can be problematic, most notably in the case
where they
are sheet tab labels, which are limited to 31 characters. For this
reason, the tool provides three options for writing slot names to the
workbook:
Slot Index Labels
Full Slot Name (truncated if necessary)
Automatically Shortened Slot Names
Slot
index labels are Slot0, Slot1, Slot2, etc. The index names are mapped
to the actual slot names on the Header sheet, but the index labels are
used in the data sheets.
The full slot names are the
object and slot name concatenated. If these are used on sheet tabs,
colons are removed because these are not legal characters on tabs.
Since the number of characters on tabs is limited to 31, the
name
is truncated to 30 characters to fit, if necessary, and a '~' is
appended to the end to show it is truncated.. If this truncating does
not make the name unique with respect to other slot names, a sequential
number is prepended to the name to make it unique. Note that
the
full object slot name is placed into the first cell (A1) of the sheet
so the actual slot can be easily determined..
Automatically shortened slot names are shortened according to the
following criteria:
"And" in the name is
replace with "&"
Colons and spaces are removed
All lower case vowels are removed
As
an example, PowellStorage becomes PwllStrg. If the shortened name is
used on sheet tabs and it still exceeds 31 characters, it is truncated
to 30 characters and a '~' is added to the end to indicate the name is
shortened. If the truncated name is not unique with respect to other
slot names, a sequential number is prepended to the name to
make
it unique. The full object slot name is placed into the first cell (A1)
of the sheet so the actual slot can be easily determined.
User
Interface
When the RdfToExcel plugin is activated, the following user interface
is presented (note that the source RDF file and the result workbook are
configured in the program calling the plugin, so are not part of this
interface):
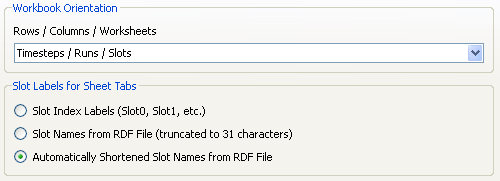
The Workbook Orientation
frame of the dialog provides a combo box with choices of
how the
workbook's rows, columns, and worksheets will map to the RDF file's
timesteps, runs, and slots. The following choices are available:
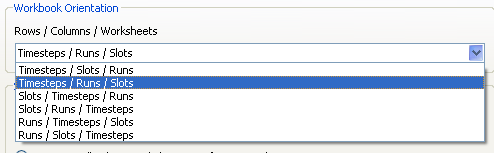
If
slots are selected to go onto worksheets, then the Slot Labels for
Sheet Tabs frame of the dialog is visible as shown above. With radio
buttons, the user selects which slot name option to use for the
worksheet's tab labels.
If slots are not selected to go onto
worksheets in the Workbook Orientation combo box, then the Slot Labels
for Sheet Tabs frame is not visible, and instead the user gets a
checkbox option for naming as shown below:
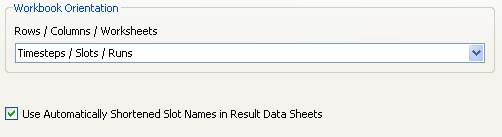
If
the checkbox is checked, automatically shortened slot names are used in
the header columns or rows, depending on the orientation. This may be
desired even though the number of characters are not limited in this
situation as in sheet tab labels in order to make the slot names
discernible without having to widen the cells so much. If the checkbox
is unchecked, the full slot name (object and slot name concatenated) is
used in header cells.
GPAT
Graphs Plugin Help Information
Table
of Contents
Overview
The
GPAT Graphs plugin will take Excel files with series data from
RiverWare or other data sources and generate graphs in an Excel
output file according to graph configurations specified in a GPAT
graphs configuration file. The Graphical Policy Analysis Tool (GPAT) is
an
add-in to Excel, so Excel must be available on the system and the GPAT
add-in must be installed in Excel for the plugin to function. A GPAT
graphs configuration file is created in GPAT and is specified in the
plugin interface to indicate what graphs are to be produced.
User
Interface
When
the GPAT Graphs plugin is activated, the following user
interface is
presented (note that the source Excel data files and the output Excel
file
with graphs are configured in RiverSMART, so are
not part of
this interface):

The
GPAT Graphs configuration file indicating what graphs should be
generated needs to be specified by typing in the path or choosing the
file with the Select... button. This is an
XML-based file that is created in GPAT and records graph configurations
created in the GPAT interface. If GPAT is installed in Excel on the
system, the Open GPAT... button will open the GPAT interface where
configuration files can be created or modified. If a configuration file
has been specified, GPAT will be opened with that
configuration
file already loaded.
The next field allows for optionally typing in or selecting an Excel
workbook for the copy result
option in GPAT. More information on this GPAT option is available in
the
GPAT help file. If graphs have been saved into the configuration file
that utilize the copy result option, then the workbook that results
will be copied into needs to be selected here. Otherwise, selection of
the copy result workbook is not applicable.
The
optional "Process input workbooks by Scenario Set" control allows input
workbooks from across scenarios to be processed together into graphs in
an output workbook. The Scenario Set list will show all scenario sets
that have been defined in the study (these are defined in the Scenario
Set Manager within RiverSMART, which allows grouping of
scenarios into defined sets). When this option is selected, each
scenario set that is checked in the list will be processed individually
by the GPAT plugin. When a set is processed, the input workbook is
found for each scenario in the set and these are passed as inputs to
GPAT. GPAT will then create graphs specified in the selected
configuration file for the input data from the scenarios in the set,
and write the graphs and associated data to the scenario set directory
in RiverSMART with the linked output workbook name. If more than
one scenario set is checked, processing then moves to the next set and
its scenarios are processed into graphs written to an output workbook
in its scenario set directory.
Source
Excel Data Workbooks
In RiverSMART, one or more Excel workbooks can be linked as source
data for the GPAT graphs plugin. As explained in the GPAT
Help, source data workbook requirements are that rows represent
timesteps, the first column of a worksheet contains the timestep names,
and the first row of a worksheet contains the column names. In
RiverWare, generating workbooks of this type directly can be
accomplished by specifying an Excel output device through the Output
Manager or by specifying the creation of Excel files in the Output
panel of the Multiple Run Management Configuration dialog. RiverWare
output files (.rdf) can also be converted to Microsoft Excel files
using the RdfToExcel plugin or RdfToExcel stand-alone
tool distributed by CADSWES. Note that column names and
worksheet names
that are specified in the saved graph configurations in the GPAT Graphs
configuration file must be present in the source data workbooks for the
graphs to be successfully generated by the plugin.
Output
Excel Workbook
The
output Excel workbook is specified by an output link from the GPAT
Graphs plugin in RiverSMART. The output for an invocation of the
GPAT Graphs code is a single workbook that contains all of the graphs
generated by the execution of the plugin based on the specified graphs
configuration file. Each graph has a data worksheet that contains the
data for the graph, and an adjacent graph worksheet that contains the
Excel plot. If an existing workbook is specified as the output
workbook, the graph worksheets are added to the workbook. Existing
worksheets in the workbook are not deleted before new graphs are
created.
A
log file is generated in the plugin's Working directory under a
subdirectory having the name of the processed scenario or scenario set.
This file will
contain any informational messages, warnings, or
error messages generated during creation of the graphs by plugin
execution.
R Plugin Help Information
Table of Contents
Overview
The R Plugin allows scripts in the R programming language to be
executed as a post-processing event in a study. R must be
installed on
the user's computer in order to utilize the R Plugin (R Installation Instructions).
The user specifies an R script file as well as a function that is defined within the specified R script file. The user can also specify arguments to pass to the function. When the plugin is executed, it will call the function and pass the arguments that have been defined..
There
are no formal restrictions on the user-defined R function that can be
called. The R Plugin does, however, provide utilities to facilitate the
integration of the post-processing outputs from R into the general RiverSMART
file management framework. This is done by making predefined arguments available that pass information such as scenario names, linked input
files and output file locations. (Note that in this R Plugin Help
document, "input files" refer to files that are inputs to the R Plugin.
These will be outputs from previous events in the study, such as a
RiverWare event or an RDFtoExcel event.)
Using the R Plugin
An
R Plugin event can be added to the post-processing of scenario data in
RiverSMART. When the R Plugin is executed, it will run a user-defined R
script in the background (i.e. no R interface will be visible).
The
file types defined and used in post-processing, RDFs and Excel
Workbooks, are linkable to the R Plugin as input files. It is up to the
user's R script to process the data provided within any input
files. The R Plugin is not linkable in the interface to any files on
its output side (i.e. the R Plugin will be the terminus of its
post-processing stream), but there is no limit to the number of R
Plugin events in a study (each as its own terminus).
RiverSMART will provide an output directory as an optional predefined argument to the plugin. The user's R script can use this specified output
directory as a location to save any files generated by the R code, but
RiverSMART will not link these files into subsequent processes.
Though RiverSMART does not force files generated by the R code to be
saved in the predefined output directory, it is highly recommended that
R scripts called from RiverSMART be written to save all output files to
this location for two reasons. First, the predefined output directory
will guarantee that R ouput files will be saved in a file structure
that is consistent with the general RiverSMART file management
framework. Second, writing files to another location within the
RiverSMART directory structure could potentially result in file naming
conflicts, or it could result in the unintentional deletion of output
files if RiverSMART clears a directory of its contents as part of the
re-execution of a portion of a study.
Steps to Use an R Plugin Event
Outside of RiverSMART
- Install R
- Create R script:
The
R script must contain, at a minimum, a single user-defined function
that matches the function named in the plugin interface. The script may
contain additional commands before or after the function definition. These
commands will get executed when the script is sourced from the RiverSMART-generated R script,
but RiverSMART will only pass arguments for the single function call.
The user-defined R script is responsible for all processing of the
data, including reading the data from the input files.
The user's script can make use of any R functionality including
sourcing other script files, calling other functions or reading data
from other files outside of the RiverSMART directory structure.
Within RiverSMART
- Add R Plugin Event to the Workspace
- Link Input Files: one or more RDF files or Excel Workbooks on the RiverSMART workspace that are outputs from another RiverSMART event
- Specify R Script
- Specify R Function
- Specify Arguments and their Values
- Specify How to Process Scenarios
- Generate and Simulate Scenarios (if not done previously)
- Post-Process Scenarios
Linking Files
RDF
and Excel Workbooks can be linked to the R Plugin as input files.
Multiple input files can be linked to a single R Plugin event, and a
single input file can be linked to multiple R Plugin events. The R
Plugin is not linkable in the interface to any files on its
output side (i.e. the R Plugin will be the terminus of its
post-processing stream).
The linked input files will be used by
RiverSMART to define the values of the <linked input file paths>
and <linked input file names> predefined arguments.
User Interface
Once an R Plugin event has been added to a study, double clicking on the R Plugin Event icon  will
open the R Plugin Configuration dialog. The R Plugin Event can be given
a name at the top of the dialog. This name will be displayed below the
event icon on the RiverSMART workspace.
will
open the R Plugin Configuration dialog. The R Plugin Event can be given
a name at the top of the dialog. This name will be displayed below the
event icon on the RiverSMART workspace.
The R Plugin Configuration dialog contains three panels. In the first,
the R script file and function are specified. In the second, arguments and their values are defined. In the third, the method for processing
scenarios is specified. Each of these is described in greater detail in
the following sections.
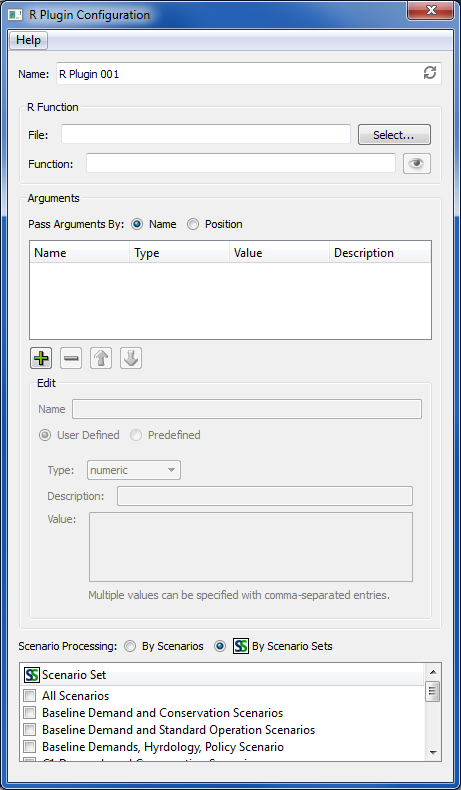
Specifying an R Script and Function
In
the top panel, the user must specify an R script file in the File field
in the R Function panel of the configuration dialog. The plugin will
create its own R script file that
will source this user-specified script file when the plugin is
executed. The file can be selected either by clicking on the  button, which will bring up a file chooser, or by typing in the file
path. Environment variables can be used in the file path, preceeded by
a "$" as shown in the image below. Once a valid file path has been
specified, the preview button
button, which will bring up a file chooser, or by typing in the file
path. Environment variables can be used in the file path, preceeded by
a "$" as shown in the image below. Once a valid file path has been
specified, the preview button  will become active. Clicking on the preview button will open a separate window with a view of the specified file.
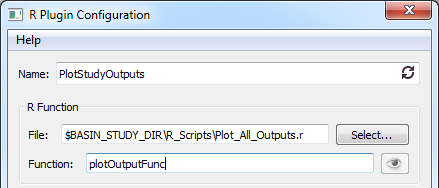
In
addition to an R script file, a function that is within that script
file must be specified. This function allows the plugin to pass
user-specified arguments to the R script. The Plugin will call the
function after sourcing the specified R script file. (Click here to see the form of the RiverSMART-generated R script.)
It
is the user's responsibility to write an R script and function that
contain appropriate R syntax. There are no limits, however, to what can
be included within the script other than it must contain the specified
function, and the function must accept the arguements specified in the
R Plugin Configuration dialog. The user-created R script can source
other files, call other functions or require any R packages that the user has installed.
Arguments
Argurments
can be passed in one of two manners: By Name or By Position. The
selection is made by clicking on the appropriate radio button in the
Arguments panel of the Configuration dialog.
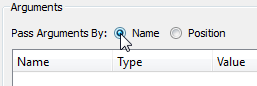
If
"By Name" is selected, the user must specify a name for each argument
in the plugin that exactly matches the name in the function definition
in their R script. In this case the order of the arguments in the
R Plugin Configuration does not matter.
If "By Position" is selected, the
argument is not given a name in the R Plugin Configuration. Instead, it
is given an index number, its position in the list of arguments. In
this case, the order of the arguments in the Plugin must match the
order of the arguments in the function definition. In general, the By
Name option is recommended.
A new argument can be added to the list by clicking on the green plus button  . A selected argument can be removed by clicking on the red minus button
  .
The order of arguments in the Plugin can be adjusted by clicking on an
argument to highlight it then clicking on the up/down arrows
.
The order of arguments in the Plugin can be adjusted by clicking on an
argument to highlight it then clicking on the up/down arrows  .
.
Adding
an argument to the list will activate the Edit panel. In the Edit panel, the name (if
using By Name), type, description and value for the argument can be
specified. The name for the argument can be any valid name in the R programming language. All alphanumeric
symbols are allowed plus ‘.’ and
‘_’, with the restriction that a name must start with
‘.’ or a letter, and if it starts with ‘.’ the
second character must not be a digit.
There are two general classes of arguments: User-defined and Predefined,
which are described below. The options for editing the type,
description and value depend on the selection of User-defined or
Predefined. The class of argument is set by clicking on the appropriate
radio button.
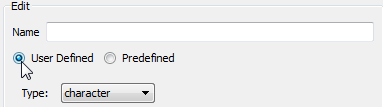
User-defined Arguments
When a User-defined argument is selected, the user can then select the type by clicking on the Type dropdown menu:
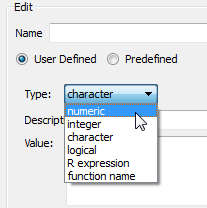
The
type of argument must match the type that is expected by the user's
function that is being called by the R Plugin. The available argument
types are described below.
An optional description of the argument can be typed into the Description field. This is for the user's reference only.
The
value for the argument can be entered in the Value field. Values
for numeric, integer and character arguments can either be a single
value or a vector with the individual elements separated by commas.
Note that it is not necessary to type in the R concatenate command,
c(...), for a vector of values. Only the commas separating the values
are required. The plugin requires a value to be specified for all arguments included in the list.
Numeric :
A
numeric argument passes a double precision vector of values (the vector
could have a length of 1). Possible valid entries for numeric argument
values are shown below.
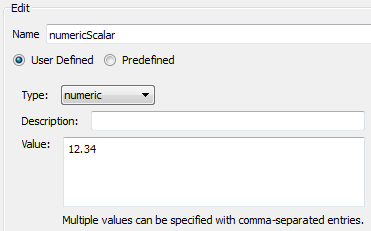
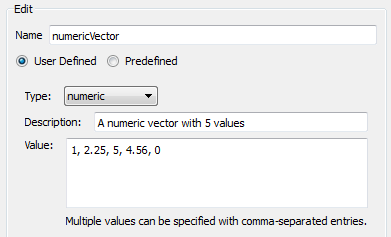
Integer:
An
integer argument is the same as a numeric, but any digits after a
decimal point will be truncated (i.e. all values will be rounded down
to the nearest whole number). So a value entered as 12.75 would get
passed to the R function as 12.
Character:
A
character argument allows a character string or a vector of character
strings to be passed. Possible valid entries for character argument values are shown
below.
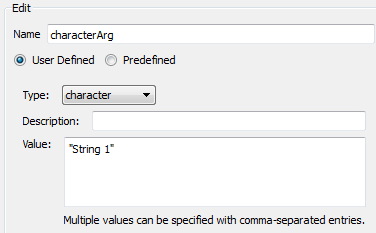
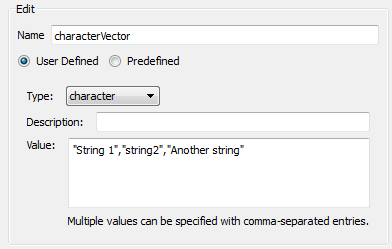
The
elements of the character argument can be written with or without
quotation marks. They will be treated the same in both cases. For
example, the following would produce the same result as the
characterVector argument definition shown above:
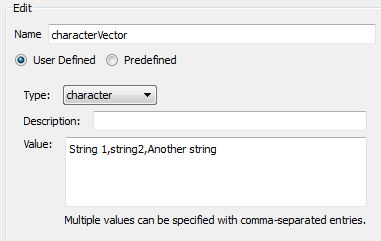
Logical:
A
logical argument passes either TRUE or FALSE. When the logical type is
selected, the appropriate TRUE/FALSE radio button can be selected to
set the value for the argument. A logical argument cannot contain
multiple values.
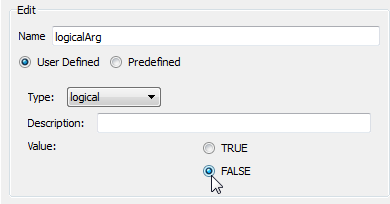
R Expression:
The
R expression argument is generic and can contain any valid R
expression. Technically, any of the previous arguments could be defined
as an R expression argument, but this type also allows commands that
are part of the R programming language to be passed as an argument
value. For example, a vector of a single value repeated 10 times could
be passed through an R expression argument using the R rep() function.
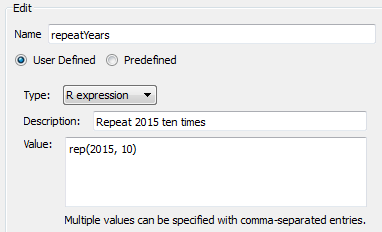
It
is up to the user to make sure that the R expression argument is
specified using appropriate R syntax. Note that it is possible to use
other arguments defined previously in the list within an R expression.
For example, say that a previous argument was of type integer with a
name N and a value of 10. The expression for the repeatYears argument
shown above could be written as
rep(2015, N)
Function Name:
The
final User-defined argument type is a function name. With this
argument, the name of a function is passed as an argument to the
function being called by the plugin. For example, in one season, values
may be processed in a specific way, but another method may be used in
other seasons.
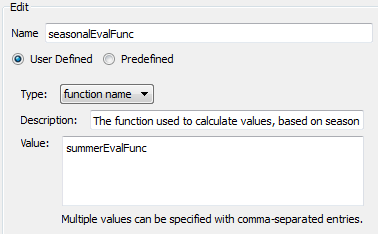
The
function name specified could be either a user-defined function or a
predefined function in the R programming language. In the case of a
user-defined function, it is up to the user to make sure that the
function is defined within their script. For a pre-defined R function,
the user must make sure that any required packages are loaded by their
script. No arguments are passed within the function name argument. Only
the function name is passed.
Predefined Arguments
When
a pre-defined argument is selected, the user chooses which predefined
argument they would like and gives the argument a name (if using By
Name). The argument's type, description and value are fixed (filled in
by RiverSMART).
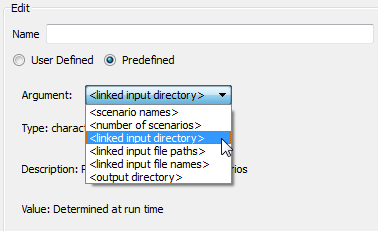
The
actual value of the argument that will be passed must be determined at
runtime, so within the argument list in the Configuration dialog, the
generic argument value will be shown (e.g. <linked input
directory>). Examples of actual values that will be passed by the
predefined arguments are shown in the table below.
Assume for this example
that the study has two supply secenarios (Wet and Dry) and two demand
scenarios (HighDemand and LowDemand), for a total of four Supply +
Demand scenarios. There are two linked rdf files: UpperBasinOutput.rdf
and LowerBasinOutput.rdf. The scenarios are processed by a scenario set called "AllScenarios"
that includes all four scenarios. The R Plugin event is named "BasinResultsR."
| Argument |
Value Passed to R |
| <linked input directory> |
“C:/users/UserName/RiverSMARTFiles/MyStudy/Scenario/” |
| <scenario names> |
c(“Dry,HighDemand”, “Dry,LowDemand”, “Wet,HighDemand”, “Wet,LowDemand”) |
| <number of scenarios> |
4 |
| <linked input file names> |
c("UpperBasinOutput.rdf", "LowerBasinOutput.rdf") |
| <linked input file paths> |
c("C:/users/UserName/RiverSMARTFiles/MyStudy/Scenario/Dry,HighDemand/UpperBasinOutput.rdf",
"C:/users/UserName/RiverSMARTFiles/MyStudy/Scenario/Dry,HighDemand/LowerBasinOutput.rdf",
"C:/users/UserName/RiverSMARTFiles/MyStudy/Scenario/Dry,LowDemand/UpperBasinOutput.rdf",
...)
|
| <output directory> |
“C:/users/UserName/RiverSMARTFiles/MyStudy/ScenarioSet/AllScenarios/BasinResultsR/” |
All predefined arguments are of the character type, with the exception of <number of scenarions>, which is an integer.
The
<linked input directory> will always be the Study Folder
specified in the main RiverSMART workspace with the /Scenario/ sub-directory appended. The use of the term "linked input" indicates
that this directory contains files that will be inputs to the R script.
The linked input directory will contain the "raw" RiverWare outputs
(typically rdf files) or outputs from another RiverSMART event.
The
<scenario names> will match the scenarios defined by the selected
scenario set, if Scenario Processing By Scenario Sets is selected. If
Scenario Processing By Scnenarios is selected, the <scenario
names> argument will be a single scenario name each time it is
passed.
The <number of scenarios> argument will be an integer equal to the length of the <scenario names> argument.
The
<linked input file names> argument contains just the general file
names (as seen in the RiverSMART workspace). It does not contain a
separate element for each individual scenario.
The <linked
input file paths> argument allows the actual files to be fully
specified for each individual scenario. The length of this character
vector will be <number of scenarions> * length<linked input
file names>.
The
<output directory> argument specifies
a file path where outputs from the R script can be saved. RiverSMART
will create the director but otherwise does nothing with this
argument directly after passing it to R. It is
up to the user to incorporate this argument into their R script
commands that write output files. RiverSMART does nothing to enforce
the use of this output location; however it is highly recommended that
R scripts called from RiverSMART be written to save all output files to
this location for two reasons. First, the predefined output directory
will guarantee that R ouput files will be saved in a file structure
that is consistent with the general RiverSMART file management
framework. Second, writing files to another location within the
RiverSMART directory structure could potentially result in file naming
conflicts, or it could result in the unintentional deletion of output
files if RiverSMART clears a directory of its contents as part of the
re-execution of a portion of a study.
For R Plugin events with processing by Scenario Sets the <output directory> will be the Study Folder
specified in the main RiverSMART workspace with the /ScenarioSet/<Scenario Set Name>/<R Plugin Name>/ sub-directory appended. If processing by Scenarios has been selected,
the <output directory> will be the Study Folder with the /Scenario/<Sceanrio Name>/<R Plugin Name>/ sub-directory appended.
Scenario Processing
At
the bottom of the R Plugin Configuration, the user can choose whether
processing should be "By Scenarios" or "By Scenario Sets."
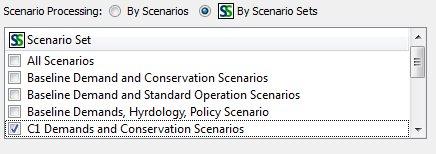
If
"By Scenarios" is selected, the Plugin will be executed once for each
scenario that is selected in the Scenario List Post-Processor dialog
(accessed by selecting Scenarios -> Post-Process Scenarios ... in
the main RiverSMART workspace). The Plugin can be executed by
selecting Scenarios -> Post-Process Checked Scenarios in the
Scenario List Post-Processor dialog, which will execute all
post-processing events for the selected scenarios. If the Plugin is
using the <scenario names> Predefined argument, its value will be
a single scenario name each time the Plugin is invoked. The <number
of scenarios> argument will have a value of 1.
If "By
Scenario Sets" is selected, a list of all scenario sets defined in the
study will appear. (Scenario sets are defined in the Scenario Set
Manager by selecting Scenarios -> Scenario Set Management ... in the
main RiverSMART workspace.) The user can then select which scenario
sets should be applied. The R Plugin will be invoked once for each
scenario set. The <scenario names> Predefined argument will be a
vector with the list of scenarios defined by the scenario set, and the
<number of scenarios> argument will be equal to the length of
that vector. When "By Scenario Sets" is selected, the Plugin can be
executed by selecting Scenarios -> R Plugin in the main RiverSMART
workspace, then selecting the appropriate R Plugin event from the
dropdown menu.
Error Handling and Log File
RiverSMART
has no knowledge of the user-created R script and thus will not report
success or failure of the script execution. It is the responsibility of
the user to verify that their R script executed successfully. Note that
RiverSMART will not automatically delete old output files generated by
the user's R script, so it is possible for old output files to exist if
the R script fails on a current invocation. It is therefore important
to check the time stamps on output files to verify that they are from
the current invocation.
To assist in verifying successful
execution or identifying errors, RiverSMART will create a log file.
After the Plugin has executed, the log can be viewed by
navigating to
<Study Folder>\Working\<Plugin Name>\<Scenario Set Name>\RPlugin.log
if using Scenario Sets or
<Study Folder>\Working\<Plugin Name>\<Scenario Name>\RPlugin.log
if post-processing by Scenarios. The RPlugin.log file can be opened in a text editor for viewing.
The
log file will contain all messages sent to R Standard Out and Standard
Error. For an execution with no errors and no output messages, the only
contents of the log file may be
STANDARD OUT ...
STANDARD ERROR ...
If an error occurs during execution messages will be printed under STANDARD ERROR ...
Any print commands in the user's script will print to the STANDARD OUT ... in the log file.
RiverSMART-Generated R Script
The
R Plugin creates an R script file that is executed by R in the
background each time the plugin is invoked. After the Plugin has executed, this file can be viewed by
navigating to
<Study Folder>\Working\<Plugin Name>\<Scenario Set Name>\RPlugin.R
if using Scenario Sets or
<Study Folder>\Working\<Plugin Name>\<Scenario Name>\RPlugin.R
if
post-processing by Scenarios. The RPlugin.R file can be opened in a
text editor for viewing. This can be useful for debugging purposes when
the user's R script does not execute as expected.
When the user has selected to pass arguments "By Position," the RiverSMART-Generated R Script has the following general form:
source(<User-specified R file>)
arg1 <- <value>
arg2 <- <value>
...
argN <- <value>
<UserSpecifiedFunction>(arg1, arg2, arg3, ..., argN)
If
the user has selected to pass arguments "By Name," the commands
assigning values to the arguments will use the argument names specified
in the R Plugin Configuration dialog. The final function call would
then have the form:
<UserSpecifiedFunction>(arg1 = arg1, arg2 = arg2, arg3 = arg3, ..., argN = argN)
This form allows the ordering of the arguments in the plugin to differ from the ordering in the function definition.
Note
that the user's R script gets sourced as the first command in the
script. Then arguments are assigned values. Then the function gets
called. This ordering allows the user to include additional commands in
their R script before the specified function is called. These could
even include additional function definitions that are then used as R
expression arguments in the plugin. This ordering also allows an
argument to be used in the definition of another argument value farther
down in the list. For example, the following list of arguments would be
valid:
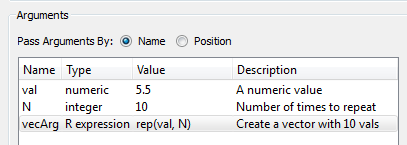
R Installation Instructions
The
R Project for Statistical Computing must be installed on the user's computer in order to utilize the R Plugin. The following
steps describe how to install R and its packages:
- Download R for Windows
- Navigate to http://cran.r-project.org/
- Select "Download R for Windows"
- Select "base"
- This
takes you to the download page for the current R version. The
RiverSMART R Plugin was developed and tested with version 3.0.2 but
should work with later versions. If necessary, versions older than the
current one can be downloaded by clicking the "Previous Releases" link
and selecting an older version.
- Save the download file to your computer.
- As
administrator, run the download file to install R on your system. The
default installation directory and other options are fine.
- Add the R executable location to your computer's "Path" environment variable.
- As administrator, go to Computer, Properties,
Advanced System Settings, and click Environment Variables.
- Under the System Variables section, highlight
"Path" and click Edit.
- Add a semicolon
to the end of the variable's value and then append the path to the directory
containing your desired R executable, for example "C:\Program
Files\R\R-3.0.2\bin\x64".
- Click Ok to save the edit
- Install packages needed by R scripts called from RiverSMART
The
R Plugin does not directly require any additional R packages to be
installed; however, the user-defined R scripts may require additional
packages. If additional packages are required, use the following steps.
- Start R as an administrator by right-clicking
its desktop icon and using that menu item.
- In the R menu bar click on Packages, then
Install Package(s)…
- You may be asked to select a mirror site from
which to download packages.
- You will get a list of available packages.
Select the appropriate packages from the list and then click OK.
- The packages should then be downloaded and
installed for you.
- Exit the R interface.
CSV
Combiner Plugin Help Information
Table
of Contents
Overview
The CSV
Combiner plugin takes separate CSV files and combines them into a
single CSV file. Input is specified as scenario sets, so CSV files from
separate scenarios can be combined into a single file that will include
data from all the scenarios in a specified set. The scenario name is
added as the first field in each line to distinguish lines for the
different scenarios. The input and output files for the event are
specified by linking CSV file icons on the workspace as input to and
output from the CSV Combiner icon. The input CSV files can have
the same columns, as named in the file header line, or can have
different columns. If a line of data does not have a value for a column
in the combined file, it shows as a blank value(i.e. ,2,,,4,).
User
Interface
When
the CSV Combiner event is opened, the following user
interface is
presented:

Specify the event name. All scenario sets, as defiined in the Scenario Set
Manager available through the Scenarios/Scenario Set Management menu
items, are presented in a checkable list. Checking a scenario
set
means an output file will be generated for the scenarios in that set,
and the file will appear in the ScenarioSet directory named with the
scenario set name. More than one set can be checked and an output CSV
file will be generated for each set.
Downloading and Configuring the R Project for Statistical Computing on Windows
- Download R for Windows
- Navigate to http://cran.r-project.org/
- Select “Download R for Windows”
- Select “base”
- This takes you to the download page for the current R version. The Study Manager
plugins were developed and tested with version 2.14.2, but they should work with later
versions. If necessary, versions older than the current one can be downloaded by
clicking the “Previous Releases” link and selecting an older version.
- Save the download file to your computer.
- As administrator, run the download file to install R on your system. The default
installation directory and other default options are fine.
- Add the R executable location to your computer’s “Path” environment variable
- As administrator, go to Computer, Properties, Advanced System Settings, and click Environment Variables.
- Under the System Variables section, highlight “Path” and click Edit.
- Add a semicolon to the end of the variable’s value and then append the path to the directory containing your desired R executable, for example “C:\Program Files\R\R-2.14.2\bin\x64”.
- Click Ok to save the edit
- Install packages needed by R scripts in the study manager
- Start R as an administrator by right-clicking its desktop icon and using the “Run as administrator” menu item.
- In the R menu bar click on Packages, then Install Package(s)…
- You may be asked to select a mirror site from which to download packages.
- You will get a list of available packages. Select the following packages from the list and then click OK:
- e1071
- ggplot2
- gplots
- msm
- Reshape
- Zoo
- The packages should then be downloaded and installed for you.
- Exit the R interface.