
Plotting and Output
Table Slots - Reverse axes
Typically, when you plot a table slot with two columns, the plot shows the first column on the X axis and the second column on the Y axis. For some slots, like the Elevation Volume table, this is not ideal; the Elevation would more naturally be on the Y axis. A user preference has been added to allow you to override this default and instead reverse axes for slots that have this type of configuration. An example of this axis switch is shown in the two plots below. The left plot is the standard plot, the right plot is switched using the new setting.
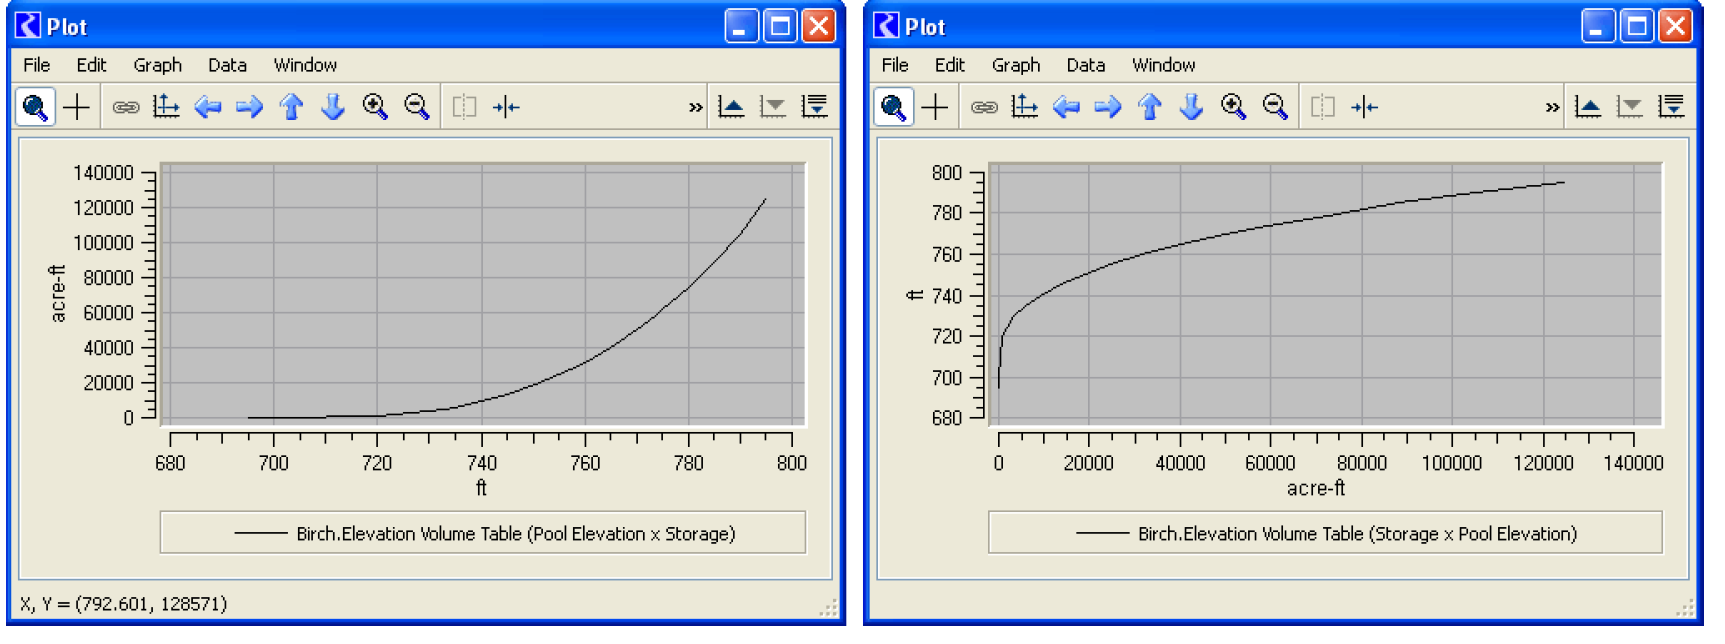
For more information, see Table Curves in Output Utilities and Data Visualization
Tabular Series Slot Report device
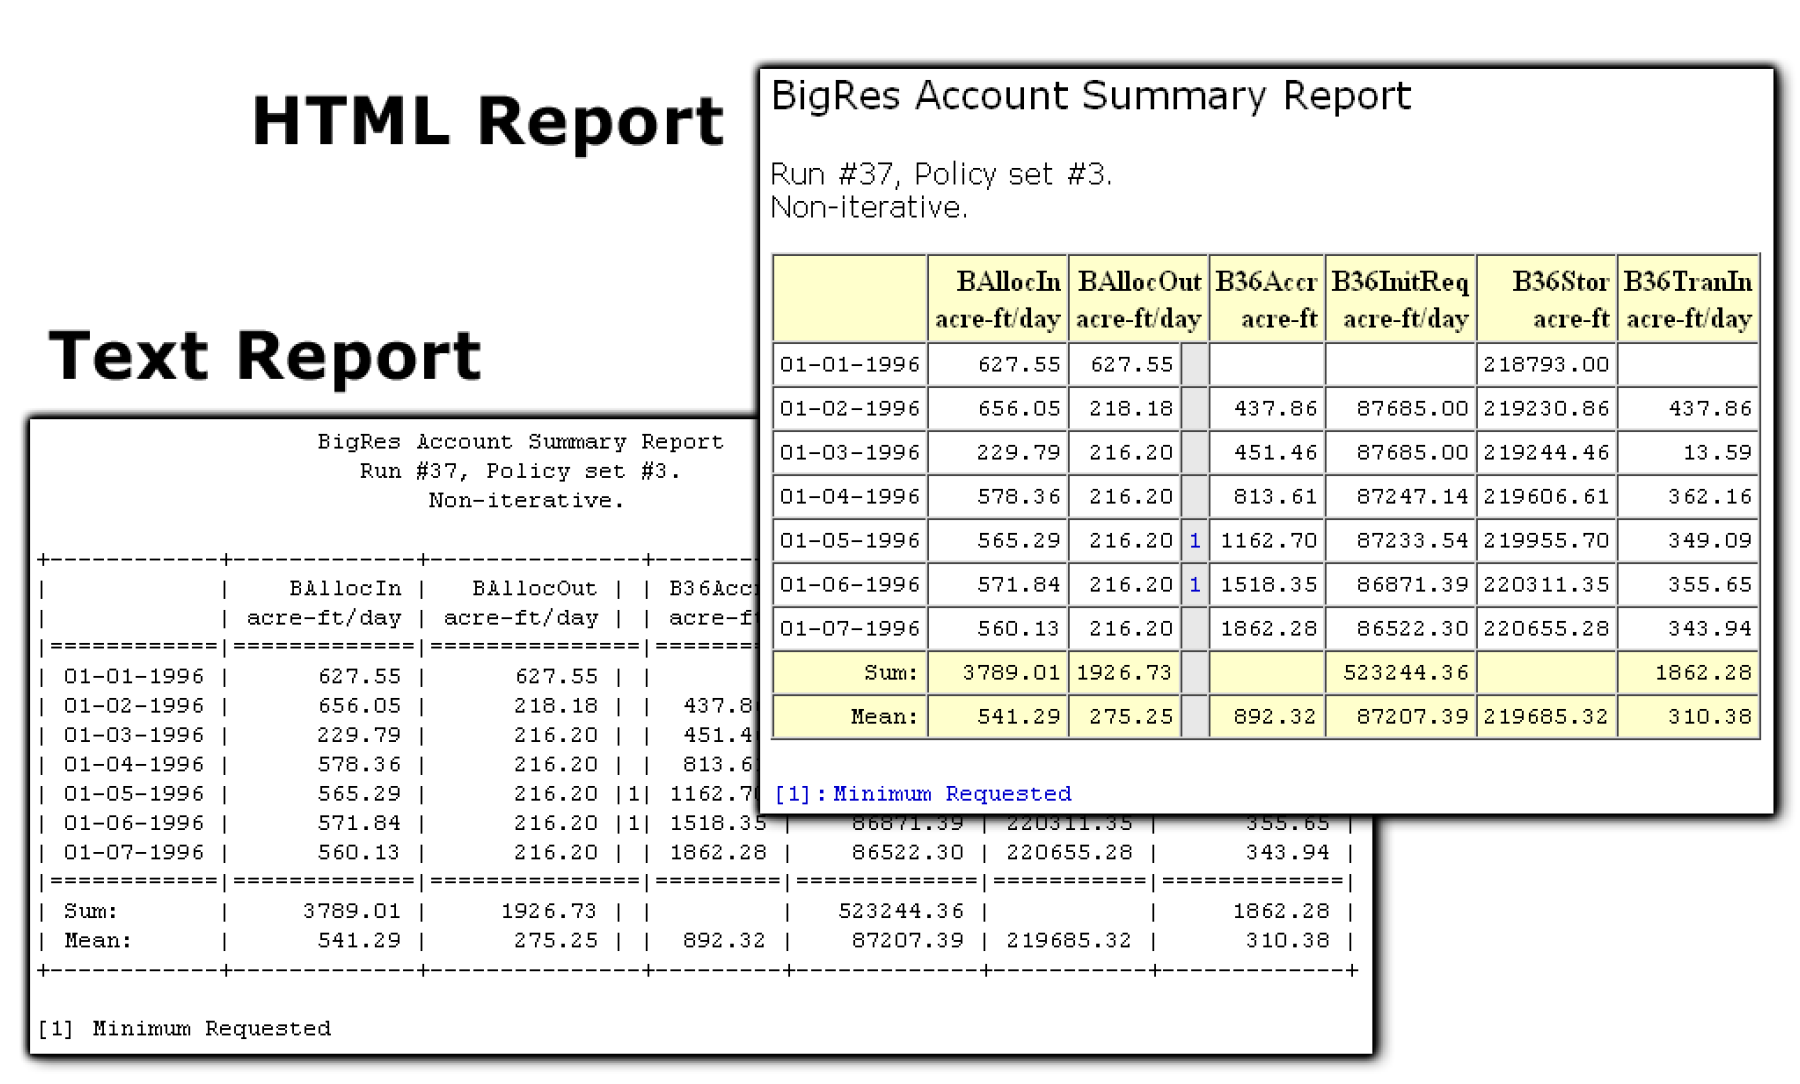
A new output device was added to the Output Manager. The Tabular Series Slot Report generates a plain text or HTML document showing, in a table or multiple tables, values for a set of series slots. The data for each series slot is displayed in one column of the table. A sample is shown below.
For more information, see Tabular Series Slot Report in Output Utilities and Data Visualization.
Revised: 08/04/2020