
Plotting and Output
Copy / Paste of Graphs
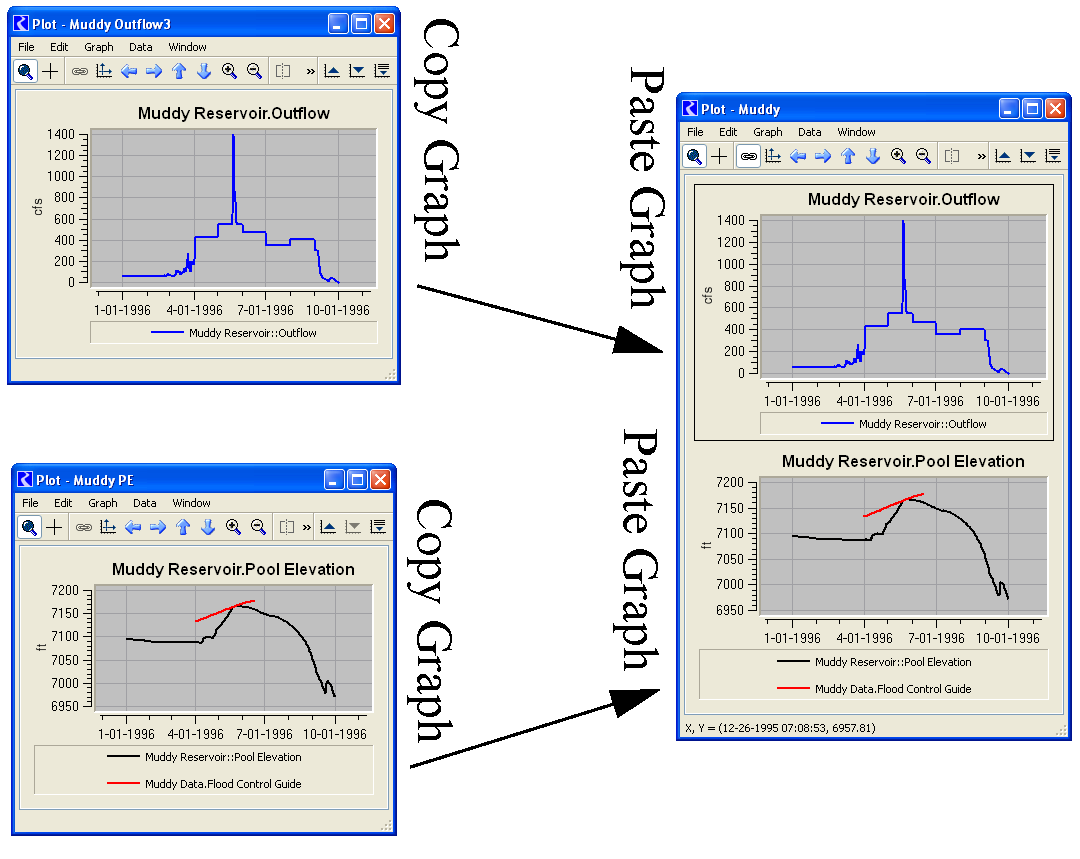
A Copy Graph and Paste Graph feature was added to allow you to move graphs (i.e. individual plots) amongst layouts. The Graph Copy Graph menu allows you to copy the selected graph to the plotting clipboard and then Graph Paste Graph menu allows you to paste that graph to a new location. These two menus allow you to quickly combine or separate multi-layout graphs. For example, you may have two great 1X1 plots configured as desired. Now you wish to combine those into a 2X1 graph so that you can see them on a linked x axis. Select a 1X1 graph and copy it. Then create a new 2X1 graph and paste the first graph onto one of the empty graphs. Repeat the copy for the second graph and then paste it into the empty graph in the 2X1 layout.
NaNs in Plots
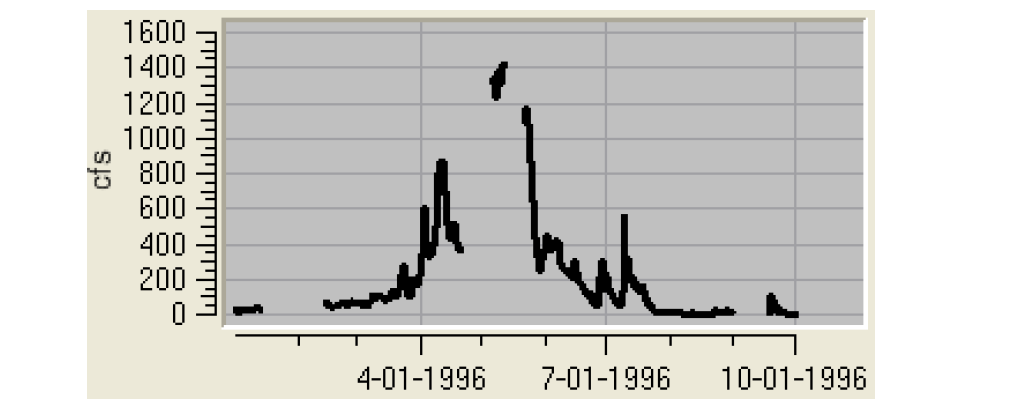
NaNs within a data series were plotted misleadingly. NaNs are now represented as a gap in the plot curve.
Open Slot from a Plot
You can now open a slot directly from a plot. Select the curve legend and choose Open Slot(s)...
Plot Templates
A new “Plot Template” device was added to the output manager. This utility allows you to:
• Create and configure a plot
• Save as a template where you specify the pieces of data you wish to be editable in that template
• Apply the template by substituting new data to generate the plot
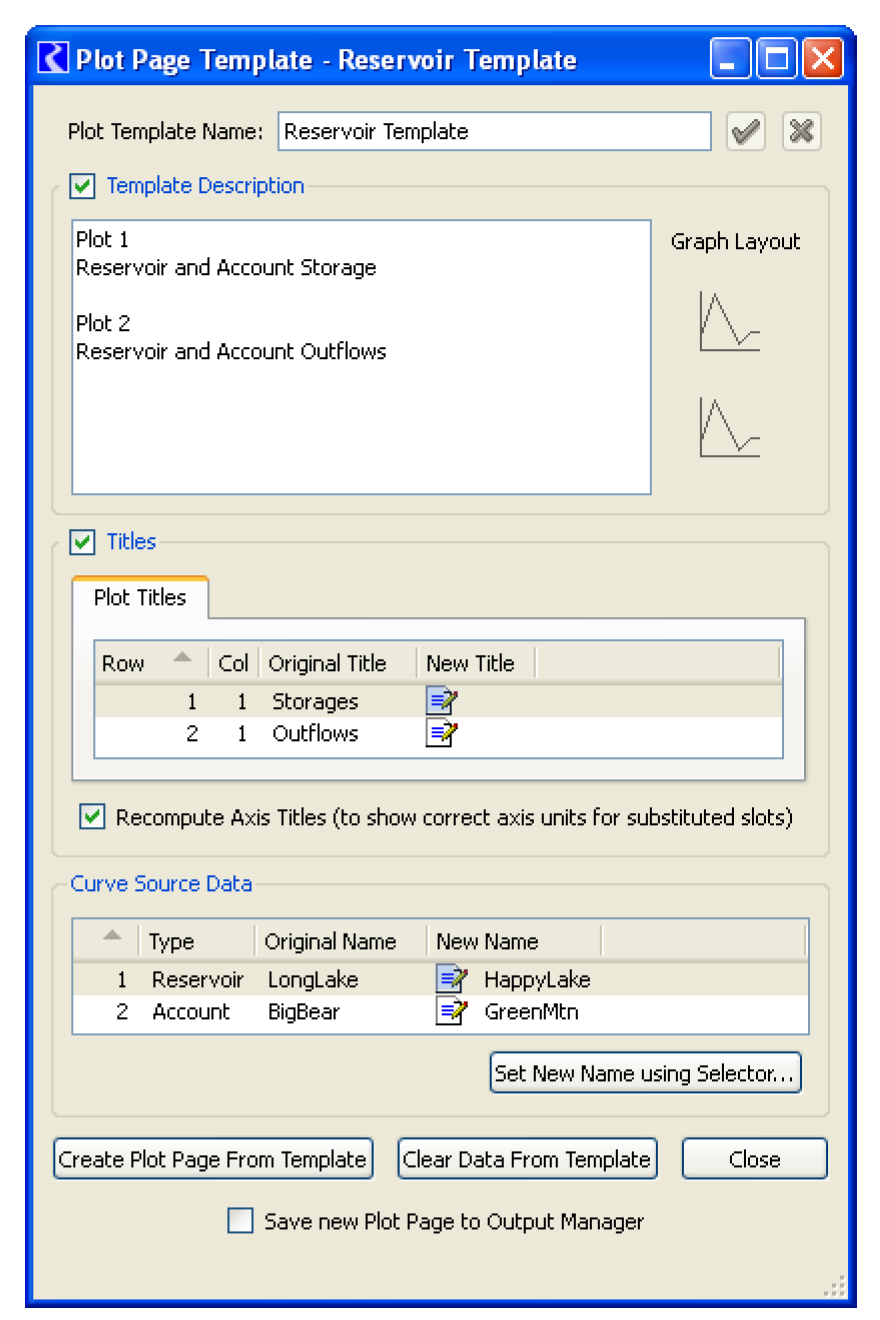
The plot template utility is described in Plotting Templates in Output Utilities and Data Visualization.
Plot Page now Allows Any Type of Slot
Any type of plot-able slot can now be added to the Slot List in the Plot Page accessible from the Output Manager. Previously, only series slots were listed. Further you can now open a slot directly from this slot list by double-clicking the slot name.
RDF Single Run Output
For the output manager's single run RDF and CDF output, the timesteps field name in the header was changed from "timesteps" to "time_steps" to match the name in MRM output as well as the documentation.
Snapshot Plots
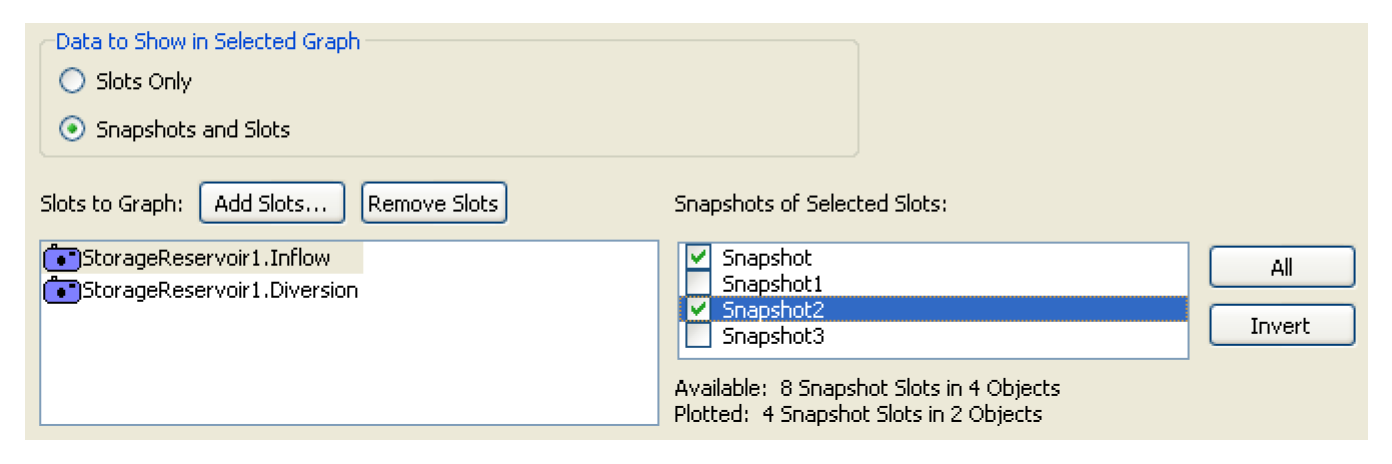
In the plot page dialog, you can specify whether to include snapshot data in plots. Previously, this was an all or nothing operations, you either showed plots of all snapshots or none. Now, snapshot slots be shown in plots on a per-snapshot selection. This is controlled through checkable items in the snapshot selection area.
Revised: 08/04/2020