
Output
The following changes have been made to Output functionality.
Plotting
Allow the Same Unit Type on Multiple Plot Axes
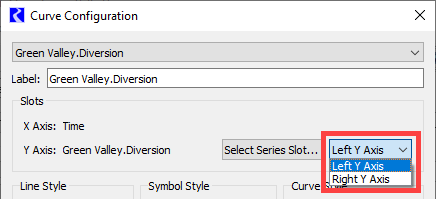
The Curve Configuration dialog box now allows you to control whether a curve is plotted on the left or right Y axis. The plot still attempts to assign a new slot to an axis that matches the slot unit type, but you can override this behavior in the Curve Configuration dialog box. See Curve Configuration in Output Utilities and Data Visualization for details.
Improved Zoom by Axes
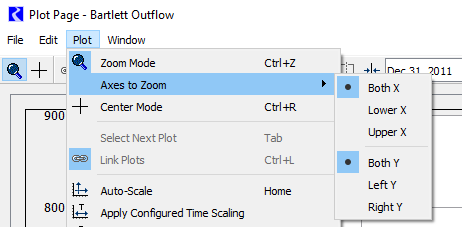
Two new settings improve control of zooming on a plot page. The options, which apply only when you draw a rectangle on the plot area, allow you to select the axes to adjust within the rectangle. The new options, shown in the screenshot, are provided when you select Plot, then Axes to Zoom.
See Plot Page Editor Menus in Output Utilities and Data Visualization for details.
Output Canvas — Link Flow Line Thresholds to Slots
Output canvas flow lines include configurable thresholds. The configuration editor was enhanced to allow more flexibility in flow line threshold specifications.
The number of thresholds on a flow line is the same for each flow line in a flow line group. Previously, threshold values were constants and you had to specify them separately for each flow line. Now, you can specify the values as a constant or by lookup on a Series, Periodic, or Scalar slot. Additionally, when you specify the threshold values by slot, if all flow lines use the same slot names, you can provide the threshold slot names at the group level and they will be used for all flow lines.
See Specifying Thresholds in Output Utilities and Data Visualization for more information.
fig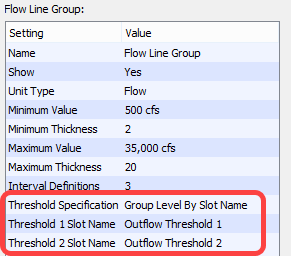
In addition, output canvas validation was enhanced to make it easier to identify problems with the configuration.
Revised: 08/02/2021