
Enable or disable aggregated view
Use this procedure to specify whether to display series slot data in aggregated or non-aggregated view.
• In non-aggregated view, each data cell displays the value of exactly one timestep, and no values are aggregated.
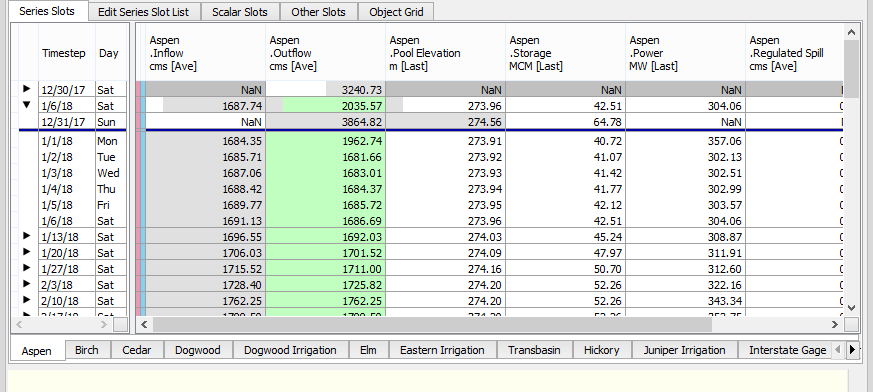
• In aggregated view, timestep values are summarized by the aggregation interval defined for the model, and the summary values are displayed. You can also select whether to display detailed values for each timestep in the aggregation interval. This view is useful for analyzing model data in different ways, especially in models with small timesteps.
Note: The aggregation function can vary by slot.
Note: You do not need to unlock the SCT configuration to perform this procedure.
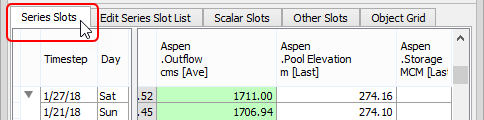
1. Go to the Series Slots tab.
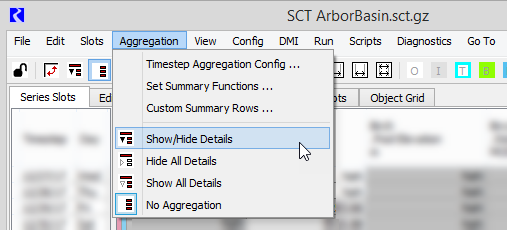
2. On the SCT menu, select Aggregation, then one of the following options:
– Show/Hide Details—displays summary and detail values in a dynamic expand/collapse format. Summary values for each aggregation interval are displayed by default, and you can selectively show and hide timestep detail for each interval using the following methods:
• Select the arrow icon next to the summary row header.
• Select one or more summary row headers and press Ctrl+D.
• Double-click a cell. This applies only if the Double Click Data Cell Toggles Detail Rows option is enabled in the SCT general configuration. See General tab.
– Hide All Details—displays summary values only; the display is locked, so you cannot expand aggregation intervals to display timestep details.
– Show All Details—displays summary and detail values for each aggregation interval; the display is locked, so you cannot collapse aggregation intervals to hide timestep details.
– No Aggregation—displays timestep detail only; values are not aggregated.
The display is updated according to your selection.
Note: The date label for each summary cell is the last day in the aggregation period. For example, if you have defined monthly aggregations starting on the first day of the month, each interval ends with the last day of the month, and the summary cell is labeled with that date: Jan 31, Feb 28 or 29, Mar 31, April 30, for example. If the first or last aggregation period is not complete, the last date in the aggregation is displayed.
Related topics
Revised: 08/02/2021