Output, Plotting, and Model Reports
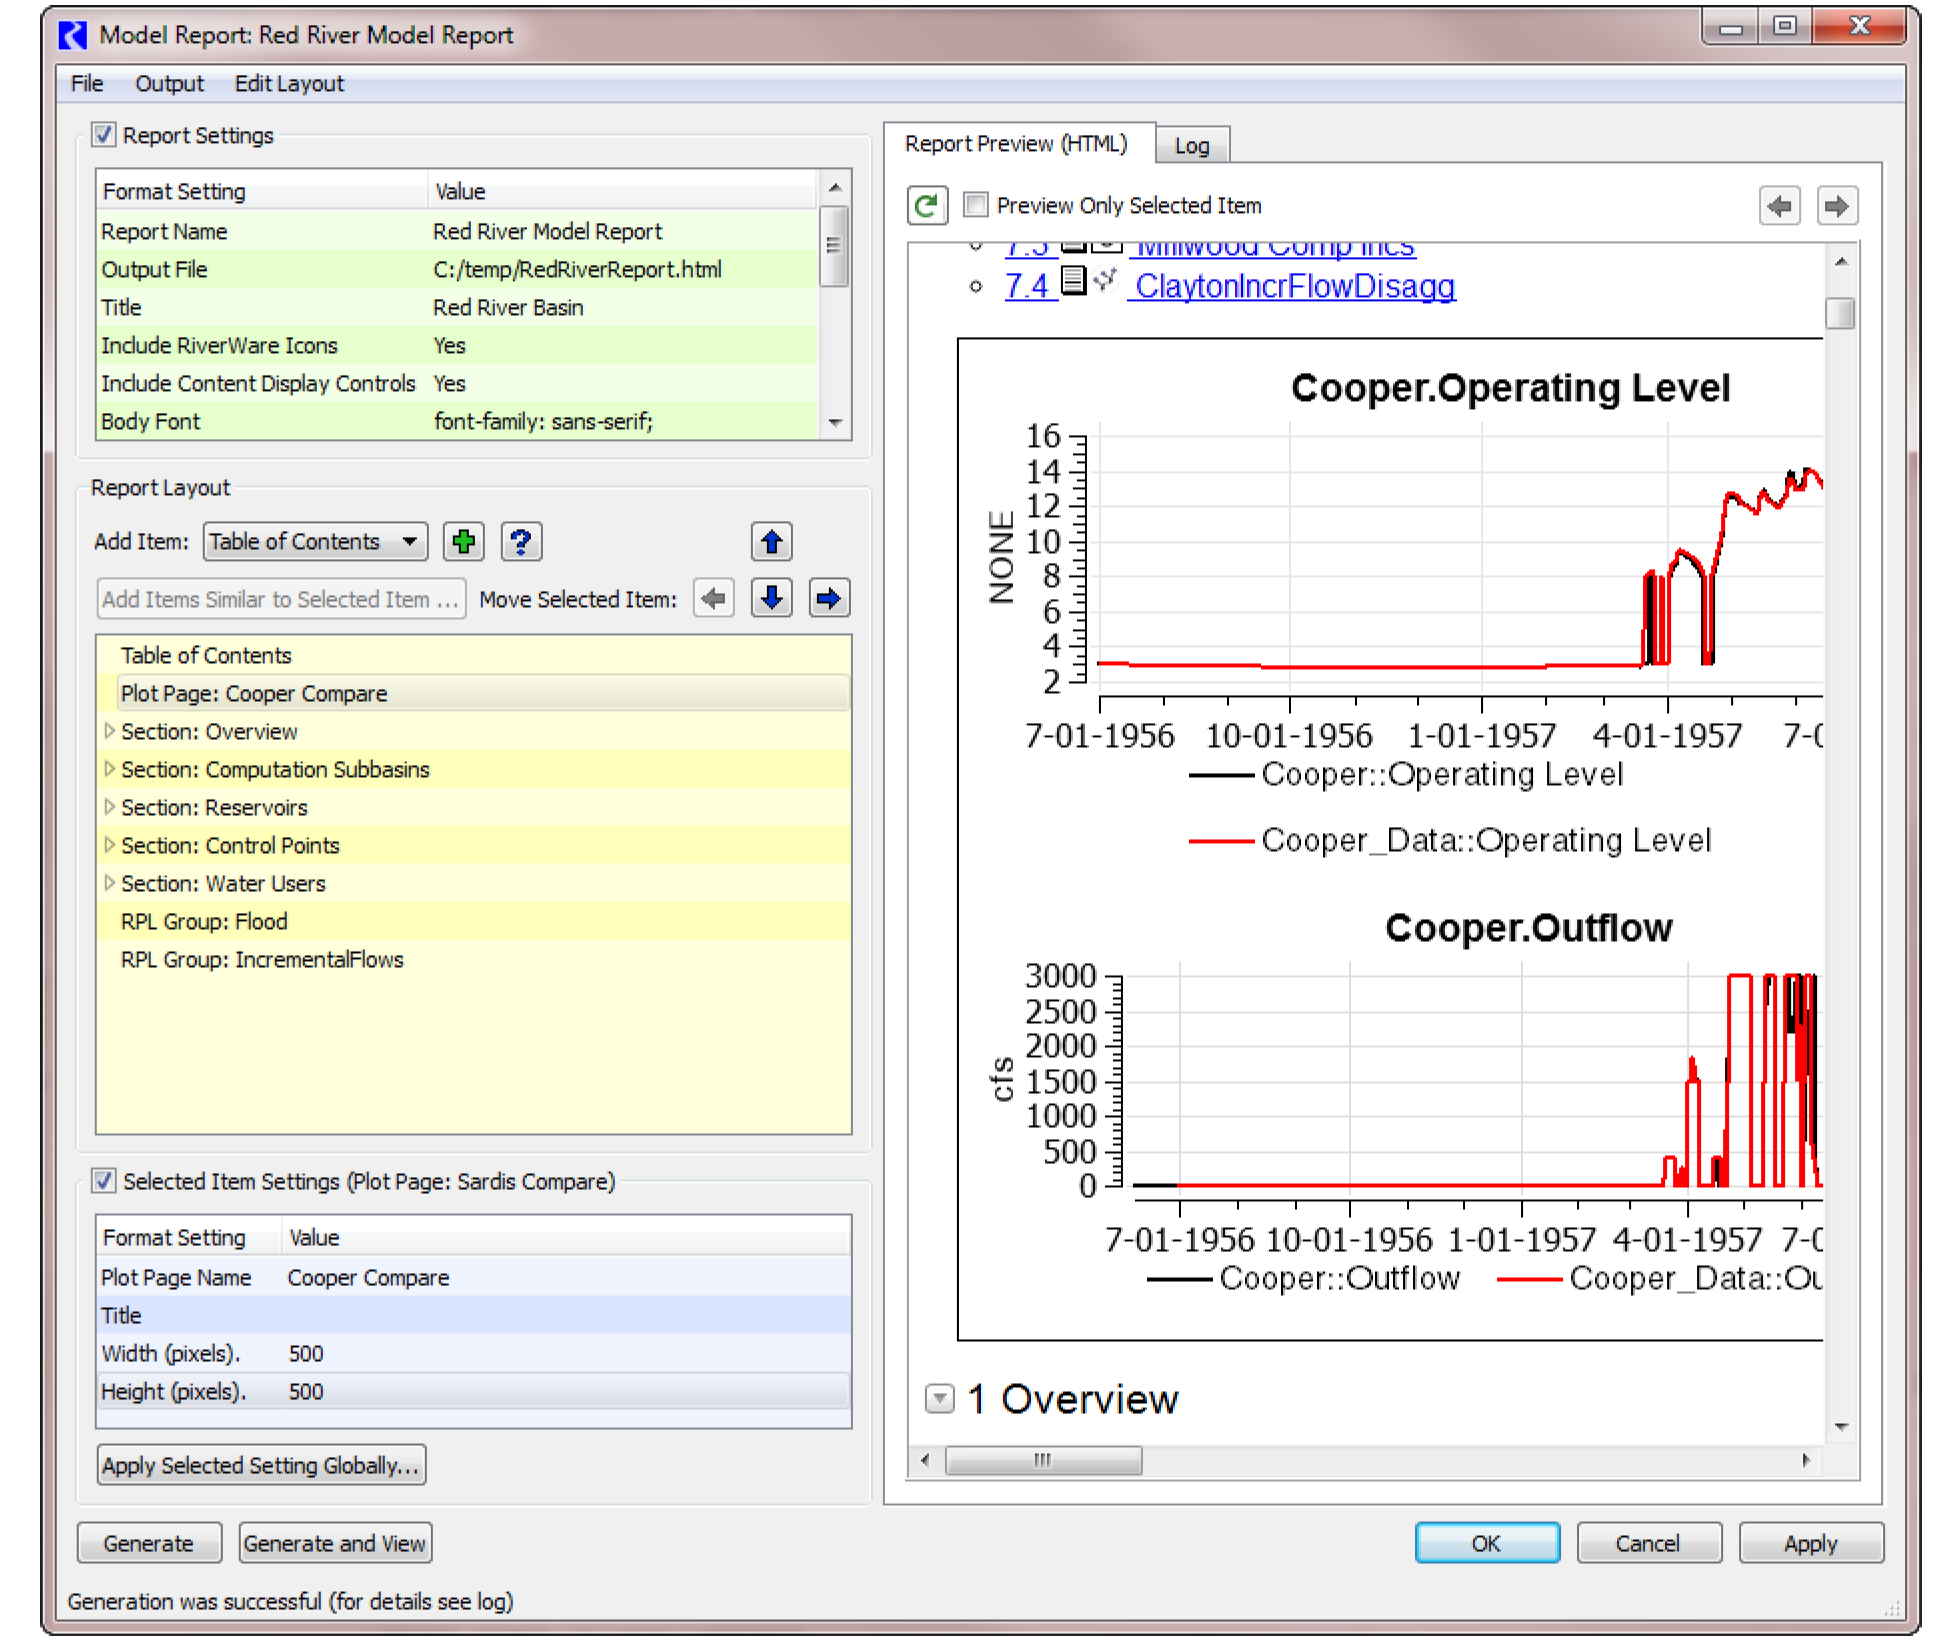
Model Reports now include Plot Pages
Model Reports now allow you to include any saved Plot Page as an item in the report. In the Model Report, you add a “Plot Page” item to the report. Then you specify the name of the Plot Page, an optional title, and the dimensions to use in the report. When the report is generated, the plot page is generated (with current data and formatting) and inserted into the HTML report as a JPG image.
This enhancement makes Model Reports a very useful tool for sharing results, writing reports, and even for general analysis. You could create a model report with all of the plots you like to see and then generate this for analysis.
For more information, see Selected Item Settings Area in Output Utilities and Data Visualization.

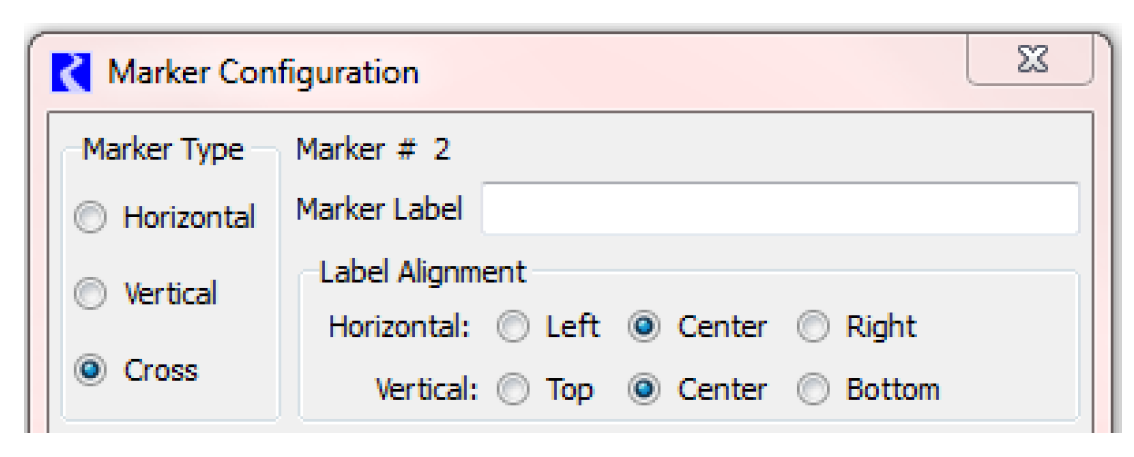
Plot Marker Configuration
The plot marker configuration was simplified. Now the label alignment allows you to choose Left, Center, or Right horizontal alignment and Top, Center, or Bottom for the vertical alignment

Printing Enhancements
Printing a Plot Page was improved so the line widths on the printed copy look more reasonable. Now there is a user specified factor that is applied to the line widths so that you have more control over the printed plot. For more information, see Plot Page Settings in Output Utilities and Data Visualization.

Revised: 01/05/2024