
Plotting
The following changes were made to Plotting
Separate Plot Legend Order and Curve Layer
New controls have been added that allow plot curve layering (i.e. the order in which the curves appear on a plot) to be specified independently from the order they appear in the plot’s legend. In the screenshot below, the panel on the right can be used to reorder the relative layers. Those items listed first will be on top.
Figure 1.5 New Reorder Plot Items with Layers Highlighted
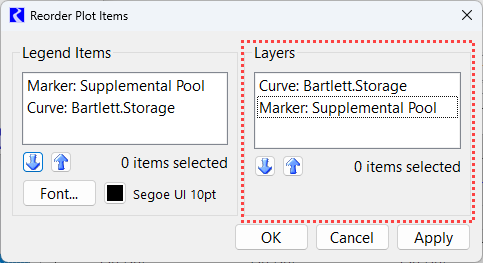
See Reorder Legend and Layers in Output Utilities and Data Visualization for more information.
Symbol Types - Circles and Squares
A plot can be configured to show symbols at the data points. Now, circles (previously called ellipses) and squares (previously called rectangles) are fully supported as symbol types.
Figure 1.6 Screenshot of a Plot Page Showing Symbols
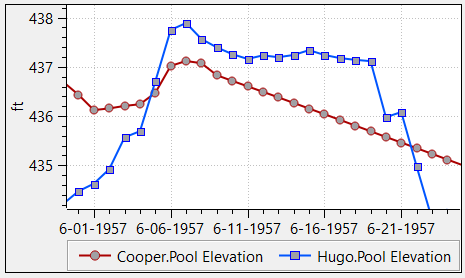
For more information, see Curve Configuration in Output Utilities and Data Visualization.
Revised: 07/03/2024