Output, Plotting, and Model Reports
Charts - Timestep Size
Pie Charts now have a configuration setting so that you can specify the timestep size to use for the animation and timestep controls. You can choose any timestep greater than or equal to the timestep of the selected data. For example, for a chart showing hourly data, you may only want to step through the pie chart at a daily timestep.

For more information, see Data Tab in Output Utilities and Data Visualization.
Comma-Separated Values Output Device
A new output device, Comma-Separated Values (CSV) file was added. This device provides options on which fields should be included in the output file and which slots to include. This new file has a format that can easily be imported into Excel or Tableau for further analysis:
Object.Slot, Timestep, Slot Value, Object Name, Unit, Year, Month
Pella.Outflow,02-29-1920 24:00:00,120.23,Pella,1 cfs,1920,February
Pella.Outflow,03-31-1920 24:00:00,133.21,Pella,1 cfs,1920,March
...
For more information on the format or configuration, see Creating a Comma-separated Values File in Output Utilities and Data Visualization.
Model Reports
Model Reports Model Report in Output Utilities and Data Visualization allow you to generate a customized HTML document describing various aspects of a model including the configuration, RPL policy, slots, and plots. Following are items that have been added to Model Reports
Date/Time Overrides on Output Items
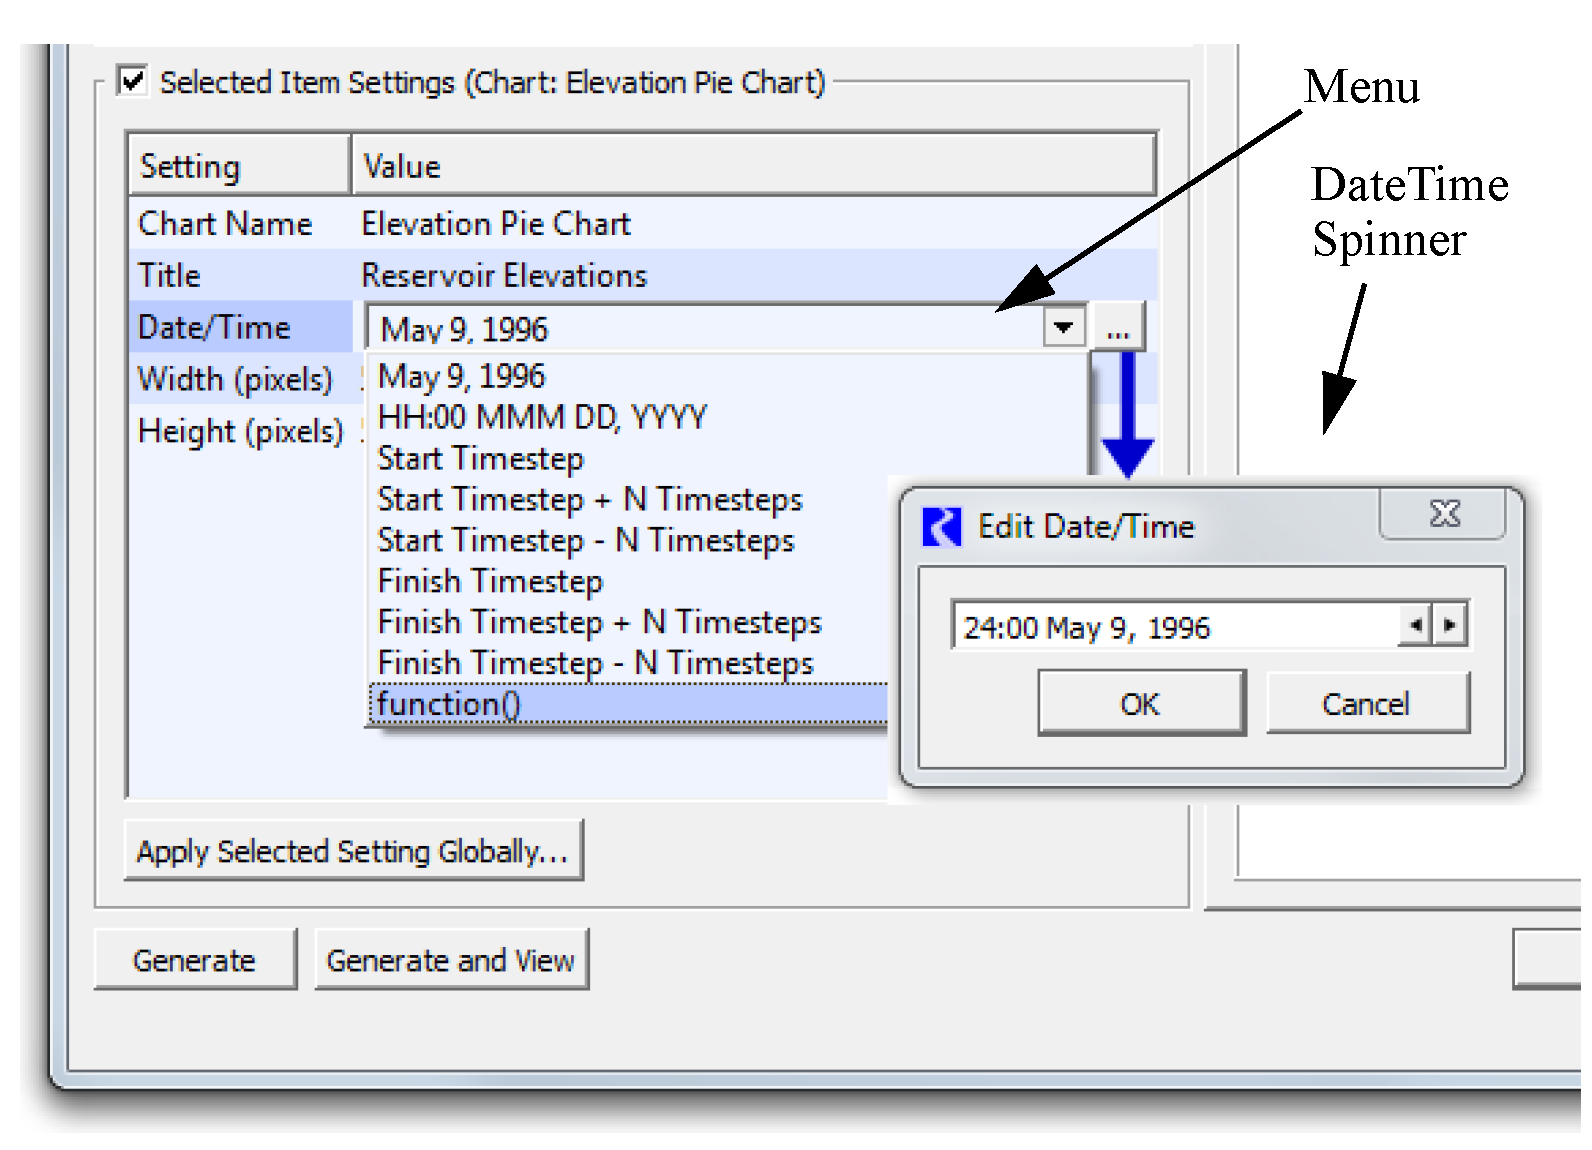
For output devices shown in a Model Report, you can now symbolically specify an override date (or start and end dates). This is possible for the following items within a Model Report:
• Chart
• Output Canvas
• Tabular Series Slot Report
• Plot Page
• Slot item (time series slot plots)
You can specify the dates as absolute dates or symbolic dates using either a common format, a RPL Date/Time or a RPL global function that returns a date/time.
Why use this functionality? Perhaps you have an operations model that is advanced forward in time every day. With these settings, the report can automatically update the output information to show the new operating range without having to manually change the dates.

For more information, see Date/Time Specification in Output Utilities and Data Visualization.
Images in Model Reports
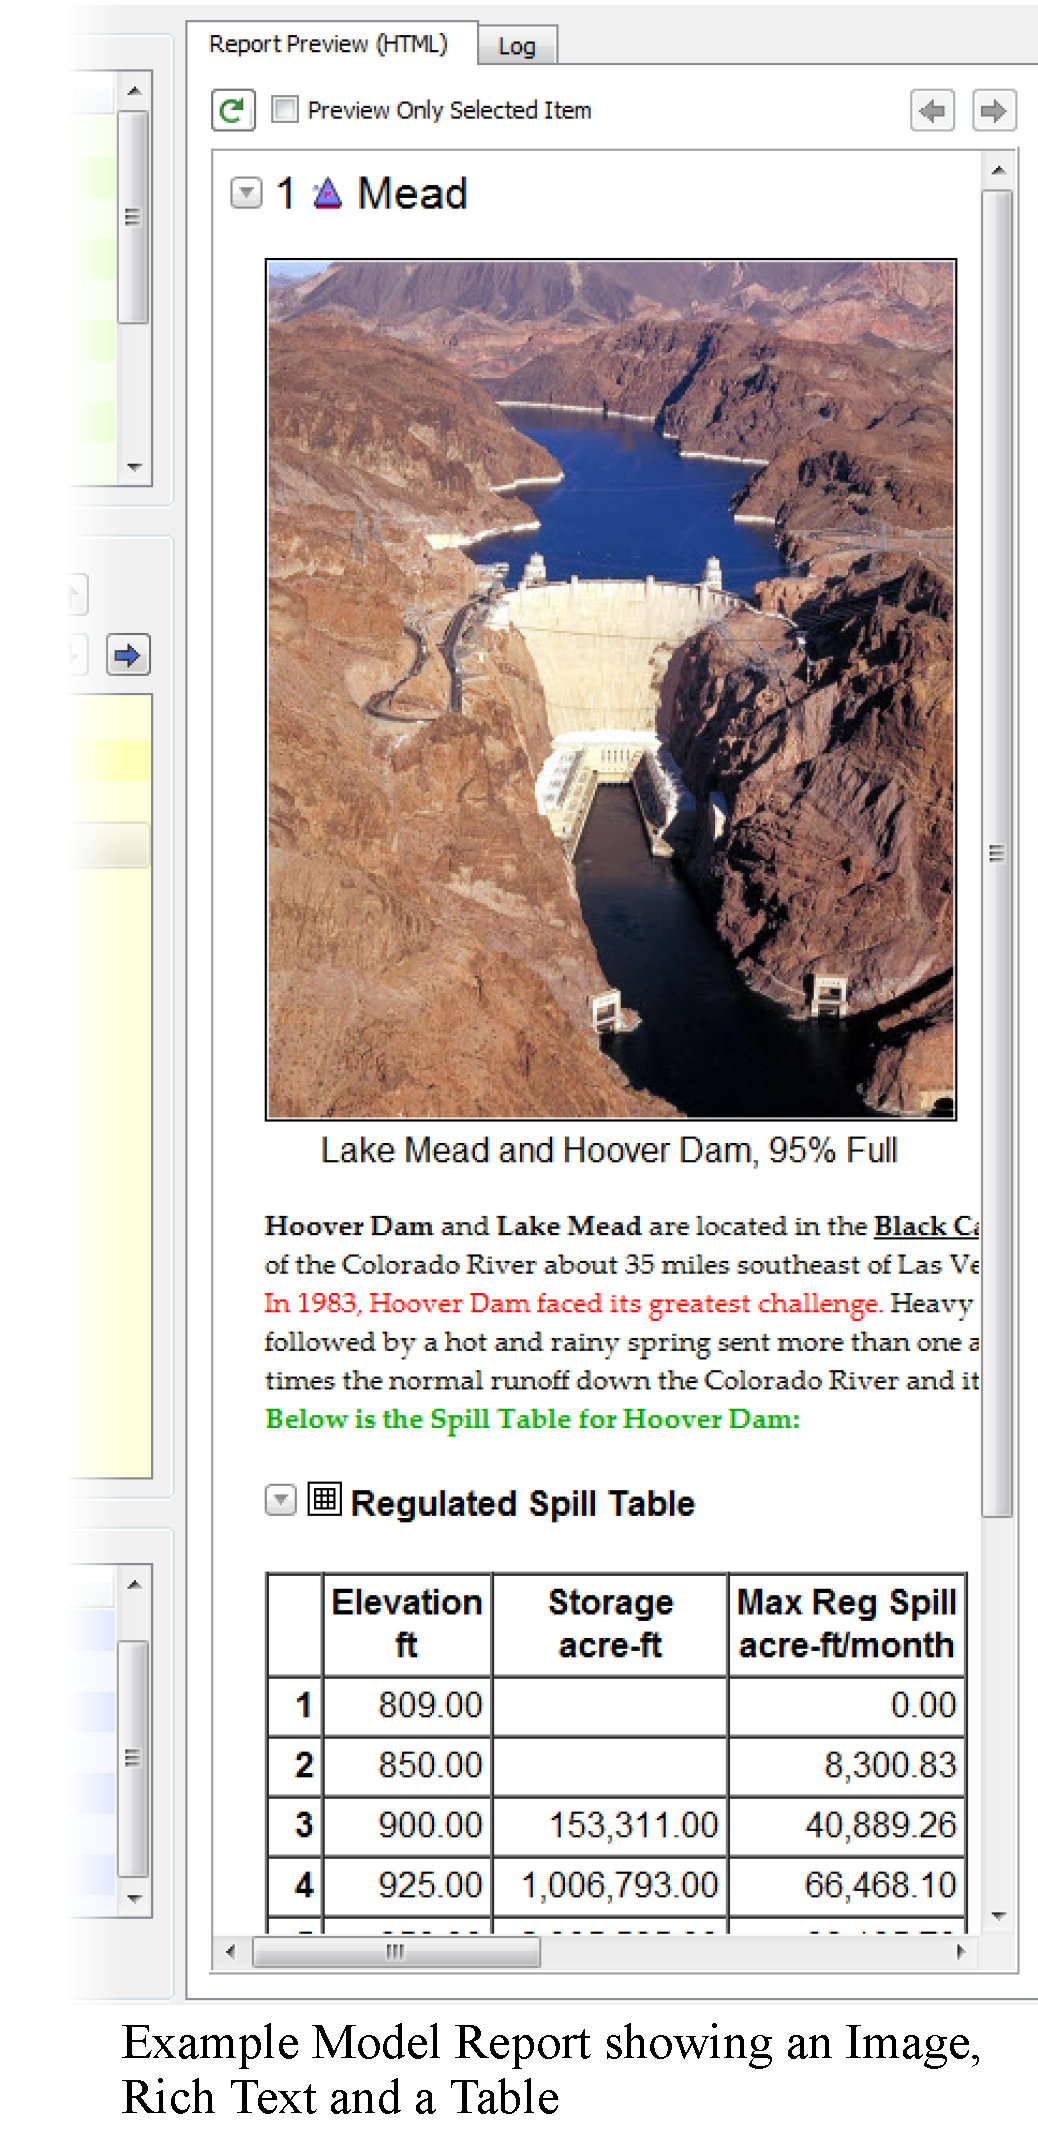
You can now add Image items to a Model Report. The Image item import an Image file (jpg or png), into a Model Report (the image is stored in the model file) and supports an optional caption text string that will be shown below the image in the generated HTML report. Following is an example screenshot.

Rich Text in Model Reports
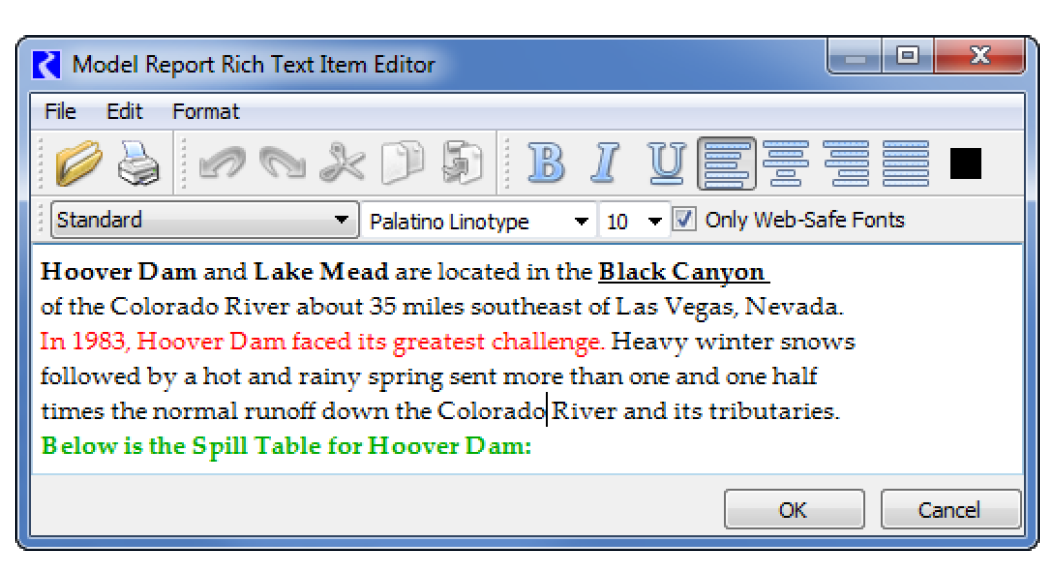
The Model Report Text item now support a Rich Text mode for basic HTML-based formatting. The provided Rich Text editor (shown below) allows you to apply formatting such as bold, italics, font, size, and even bullets and alignment. Further, copied text from external applications, like Microsoft Word, will retain much of their formatting when pasted. This allows you to copy rich text from an external document and paste it into the model report.

Output Canvas
The Output Canvas, described Output Canvas in Output Utilities and Data Visualization, allows for visualization of outputs in a spatially distributed way. Previously, you could show teacups, images, and basic text. The following features were added.
Flow Lines
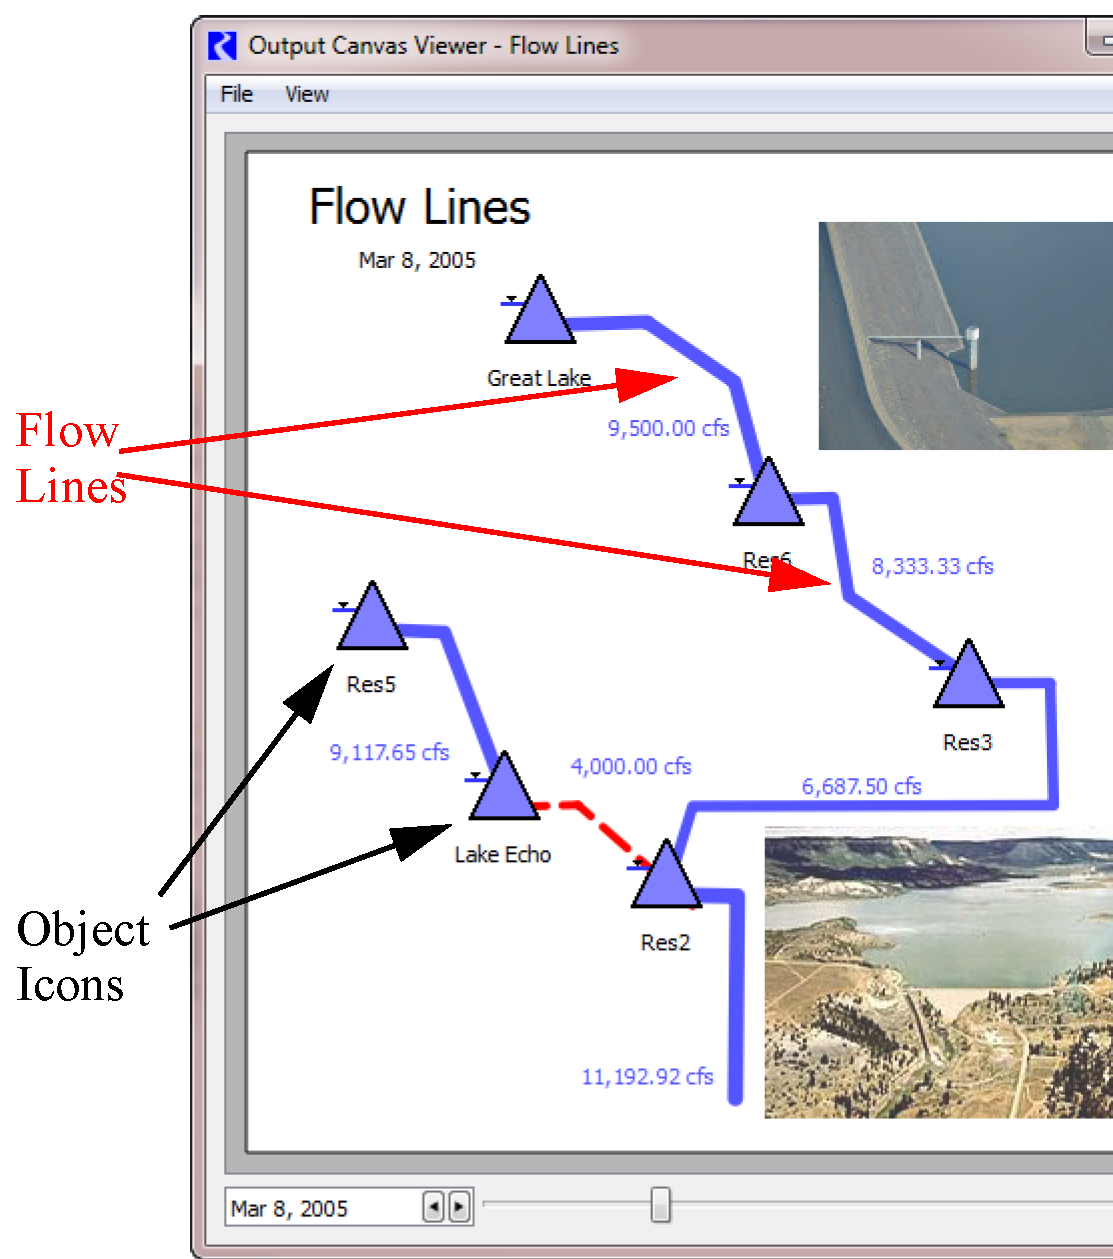
Flow Line Groups and Flow Lines was added to the Output Canvas. Simply, a flow line is a poly-line on the output canvas that is typically associated with a slot value, often the flow in a river. You can configure the flow lines to change width based on the flow compared to other values in the group and change color and line type as the flow crosses thresholds defined on each particular flow line. For more information, see Flow Line Configuration in Output Utilities and Data Visualization.

Object Icons
This new type of output canvas graphic object displays the Object Icon associated with a particular simulation object. Object icon groups support optional dynamic text items which can include values of slots on the object or the related data object.
Revised: 01/10/2025