Making a Run
The dialog is opened by selecting Control, then Run Control Panel from the workspace menu bar or by clicking on the Run Control toolbar button.


Tip: See Run Controls Panel for an alternative way to make runs directly from the workspace.
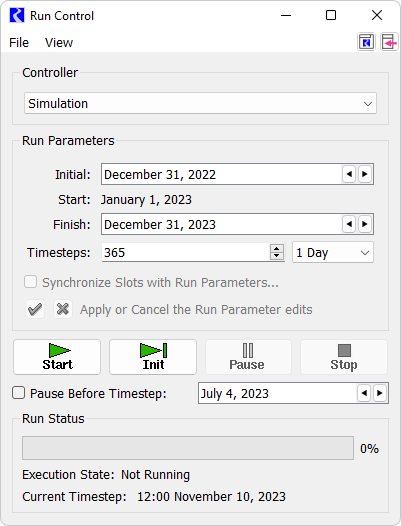
The buttons are used to control the execution of a model. They are as follows.
•  Confirm. Confirm run control changes (i.e., changes to number of timesteps, run parameters, or simulation type).
 Confirm. Confirm run control changes (i.e., changes to number of timesteps, run parameters, or simulation type).
•  . Reject. Reject run control changes.
 . Reject. Reject run control changes.
•  Open RPL Debugger. Optionally shown, use this button to open the RPL Debugger. See Enabling RPL Debugging in Debugging and Analysis for details.
 Open RPL Debugger. Optionally shown, use this button to open the RPL Debugger. See Enabling RPL Debugging in Debugging and Analysis for details.
 •  RPL Debugger Enabled or
  RPL Debugger Disabled. Optionally shown, this button both shows the status of RPL Debugging and is a toggle to enable or disable. See Enabling RPL Debugging in Debugging and Analysis for details.
 RPL Debugger Enabled or
  RPL Debugger Disabled. Optionally shown, this button both shows the status of RPL Debugging and is a toggle to enable or disable. See Enabling RPL Debugging in Debugging and Analysis for details.
 • Start. Execute a run.
• Init. Execute the initialization phase of the run.
• Step. When paused in a run, Step to execute the next controller timestep only.
• Pause. Interrupt execution after the current timestep.
• Continue. Continue execution from the current timestep.
• Stop. Stop the run after the current timestep.
• Pause Before Timestep. Pause the run before the specified timestep. This is particularly useful when debugging a model run.

• Execute Initialization Rules. Specify whether to execute Initialization Rules. The check box is only available when Initialization Rules are defined. See About RPL Sets in RiverWare Policy Language (RPL) for details.
When a run is not in progress, only the Start and Step buttons are available. If changes are made to the run dates, the timesteps, or other Run Control parameters, the Check button  must be clicked to enable all the other Run Control buttons. The Continue, Step and Pause buttons are then enabled after the Initializing period has ended.
 must be clicked to enable all the other Run Control buttons. The Continue, Step and Pause buttons are then enabled after the Initializing period has ended.
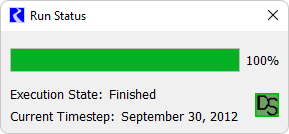
When a run is started, the Run Status area is updated. You can see a separate version of this dialog using the View, then Run Status menu.
The indicator bar moves from left (start) to right (finish), indicating the progress of the run. The Execution State: also indicates the state of the run with a status description. The possible Execution States are: Initializing, Running, Finished, Stopped, Waiting, Paused, and Aborted.
Also shown is a button to access the Model Run Analysis tool. See Model Run Analysis in Debugging and Analysis. This button is shown as a grey square during a run and then a summary icon once the run completes or is paused/stopped. Select the button to open the tool. Shift-click to see the Dispatch Status Summary information.

The Controller Clock (date and time of the currently executing timestep expressed in units of the selected timestep size) is displayed under the Execution State. Due to time horizon dispatching, the Controller Clock may not represent the timesteps of all objects being solved. See Time Horizon Simulation in Solution Approaches for details.
Note: When there is more than one Run Cycle, the Run Cycle is listed in the Timestep and there are controls for the Run Cycle in the Pause Before Timestep line. See Run Cycles in Solution Approaches for details.
Revised: 01/10/2025