Output Devices
Charts: Video File Animation Generation
Chart animation video files can be generated directly from RiverWare. Basic settings include the frame sampling timestep size, frames per seconds, and format. Four video formats are supported:
• MP4,
• WEBM,
• WMV, and
• animated GIF
In addition, there are advanced settings available for complete customization of the export process.
For more information, see Export Video in Output Utilities and Data Visualization.
Output Canvas
The Output Canvas, described in Output Canvas in Output Utilities and Data Visualization, allows for visualization of outputs in spatially distributed teacups and flow lines. The following improvements have been added to the Output Canvas:
Canvas Lines
Canvas Lines provide generic lines on the canvas. You can use these for many purposes but were designed to provide pointers to locations on the canvas. You can add end symbols including dots (shown to the right), triangles, and arrow heads. More information is available in Canvas Line Group in Output Utilities and Data Visualization.

Charts on an Output Canvas
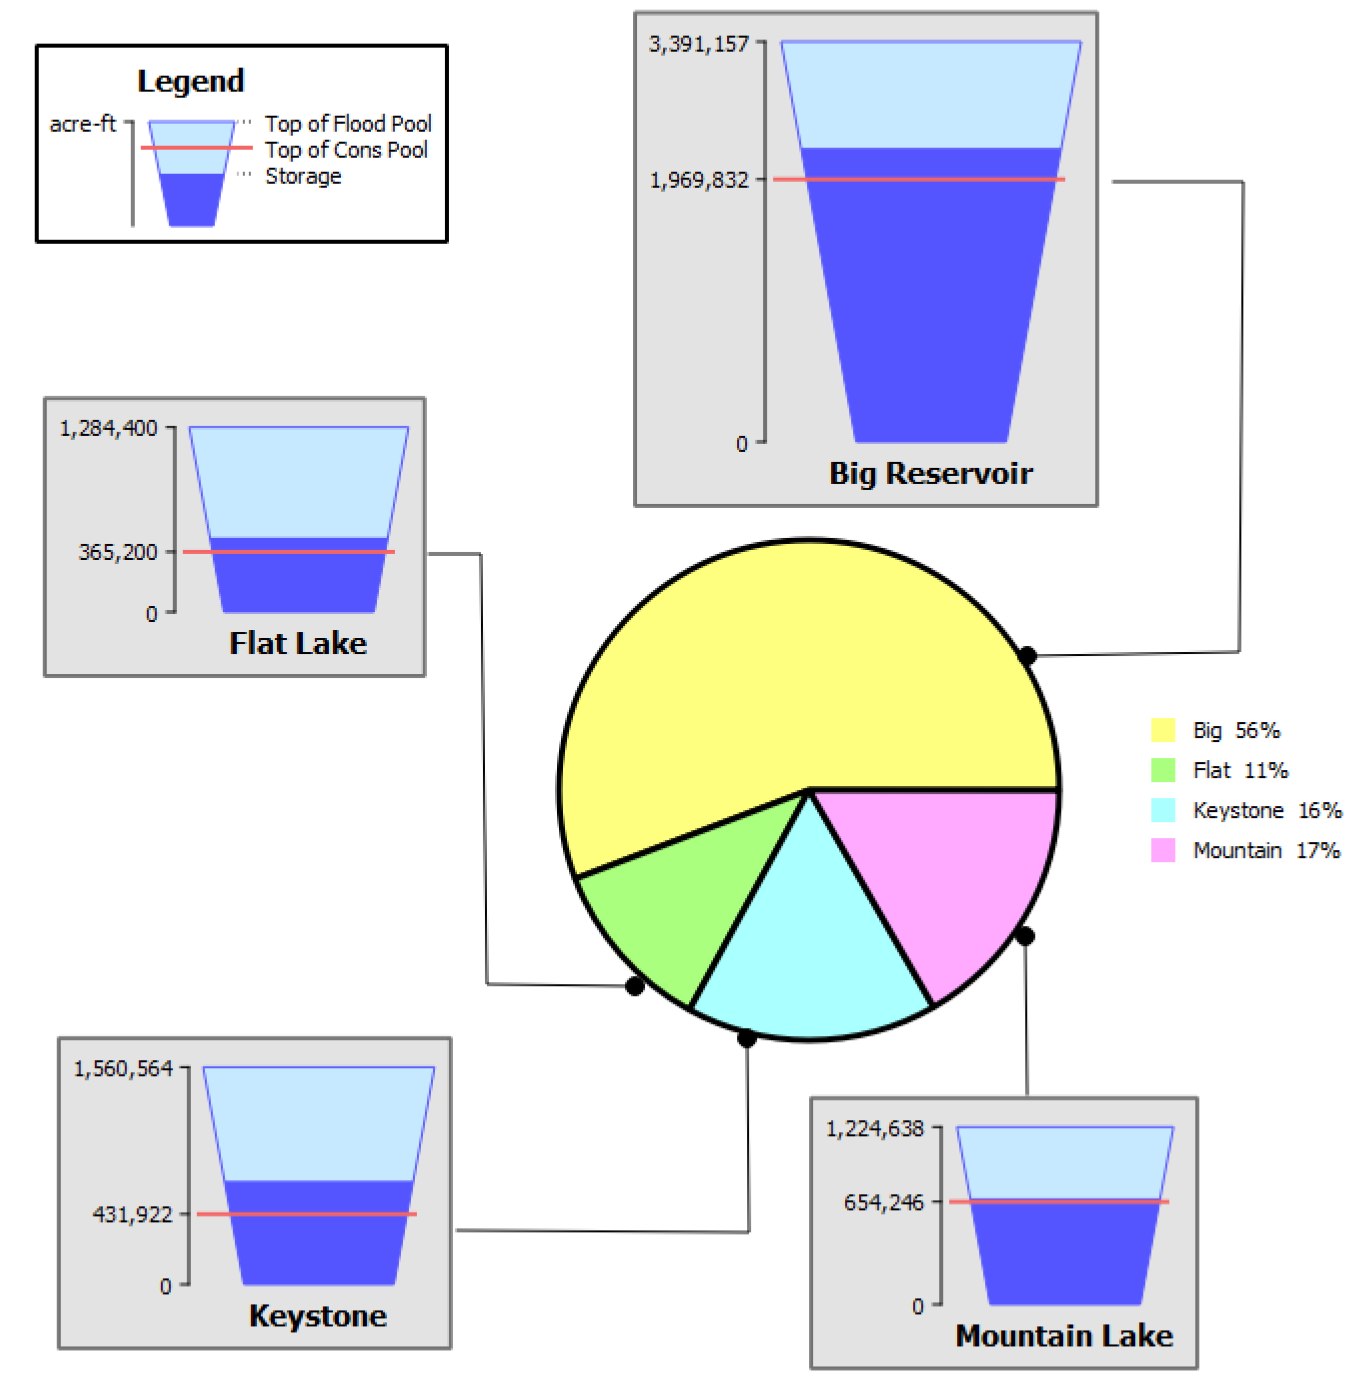
Charts can now be placed on an Output Canvas and will animate at the same time as the canvas. Handles are available for resizing and scaling the selected chart. Geometry fixes to avoid clipping of the chart image due to the chart size specified within the Output Canvas configuration were also implemented. More information is available in Chart Group in Output Utilities and Data Visualization.
Miscellaneous Enhancements
Following are three miscellaneous enhancements made to the Output Canvas:
• Precision overrides were added for numeric values shown in Teacup, Object Icon, and Text Groups. This setting allows you to control how many digits are shown after the decimal.
• Plain-Text items now allow you to enter multiple lines of text as configured in the editor.
• In Slot Value Text Items, the RPL Priority value can now be shown.
Plotting
New approach to View and Edit Plot Pages
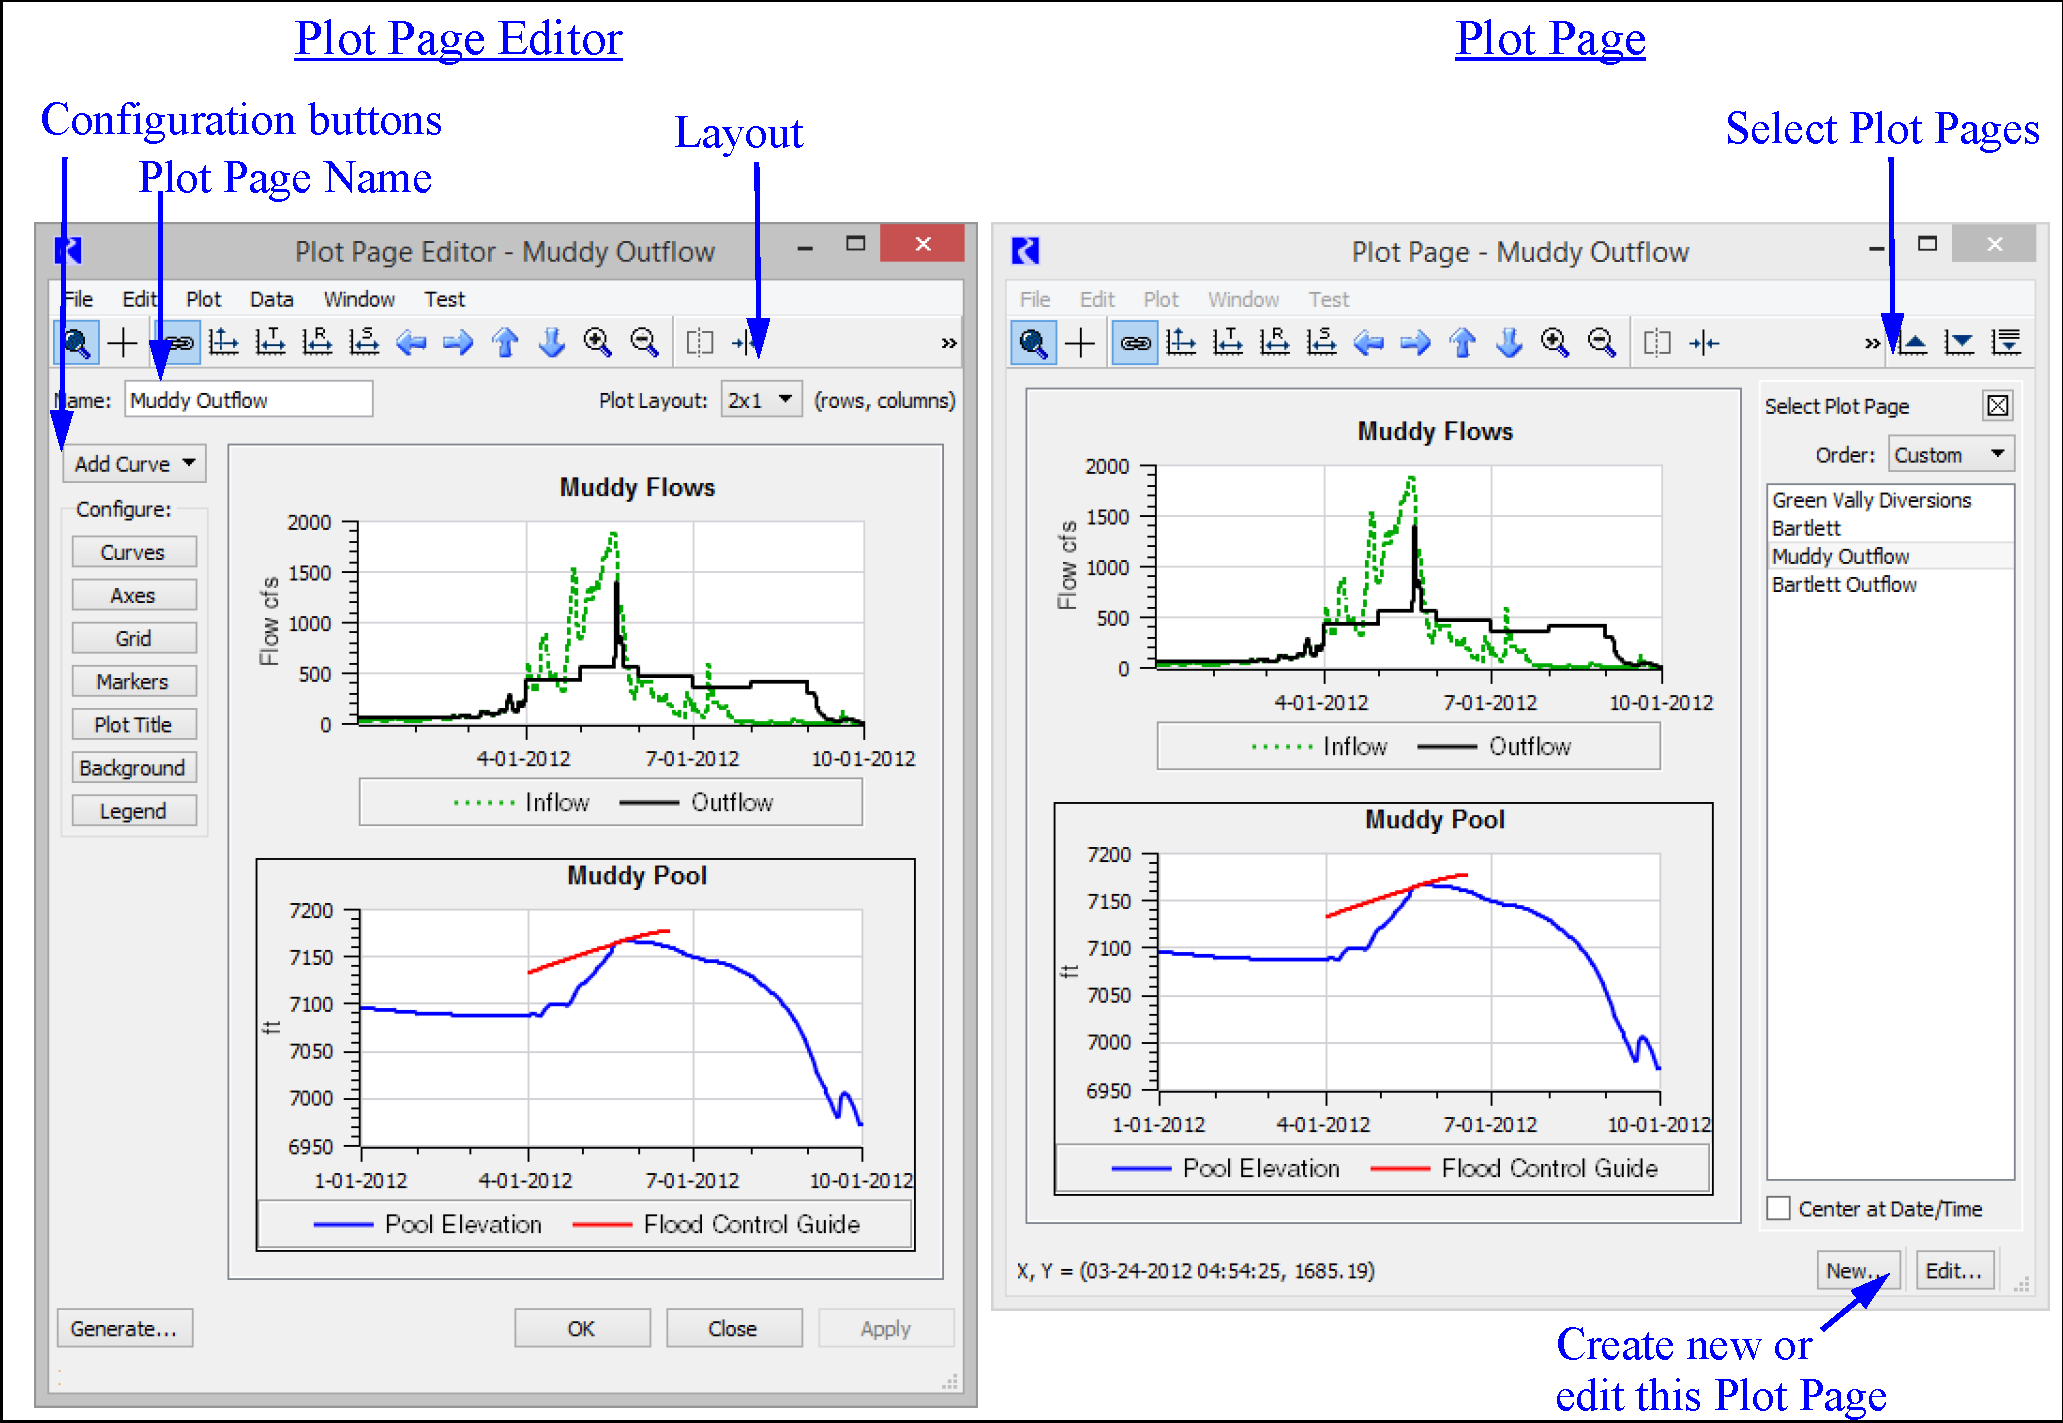
The Plotting utility was modified to remove the Save approach. Now there is a separate Plot Page Editor used to configure the plots and then the Plot Page used to view and interact with a plot.
• Plot Page Editor: The editor is used to modify the slots shown and the appearance of the plot (colors, line types, markers, etc). New buttons on the left side provide access to add curves and configure the plots. This is shown below on the left.
• Plot Page: The Plot Page displays the plots and provides interaction with multiple plots. This is shown below on the right.
For more information, see in Output Utilities and Data Visualization.

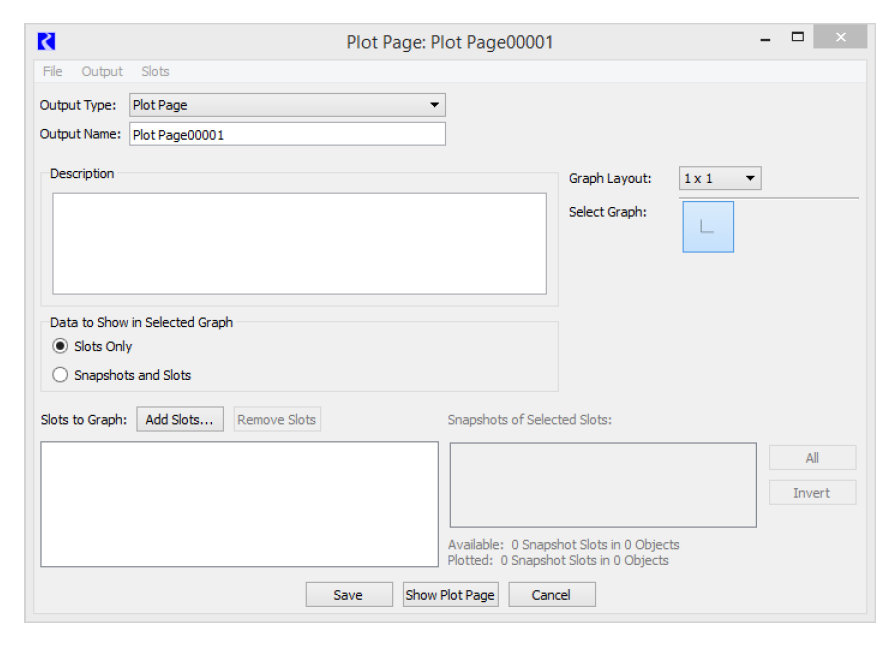
In addition, the original plot page dialog (shown to the right), used to select a list of slots to plot, was removed. all configuration is performed in the Plot Page Editor shown in the above left screenshot.

As a result, all snapshot slots can be added directly to a Plot as a unique curve. There is no longer an associated show “Snapshots and Slots” option.
Plotting Scalars
Scalar Slots can now appear in time series plots. Scalars with datetime units are shown as vertical lines. Scalars with any other unit type are shown as horizontal lines.
Time Scaling
The plotting utility now supports a new configurable Time Scaling feature for time series plots. This includes the following provisions:
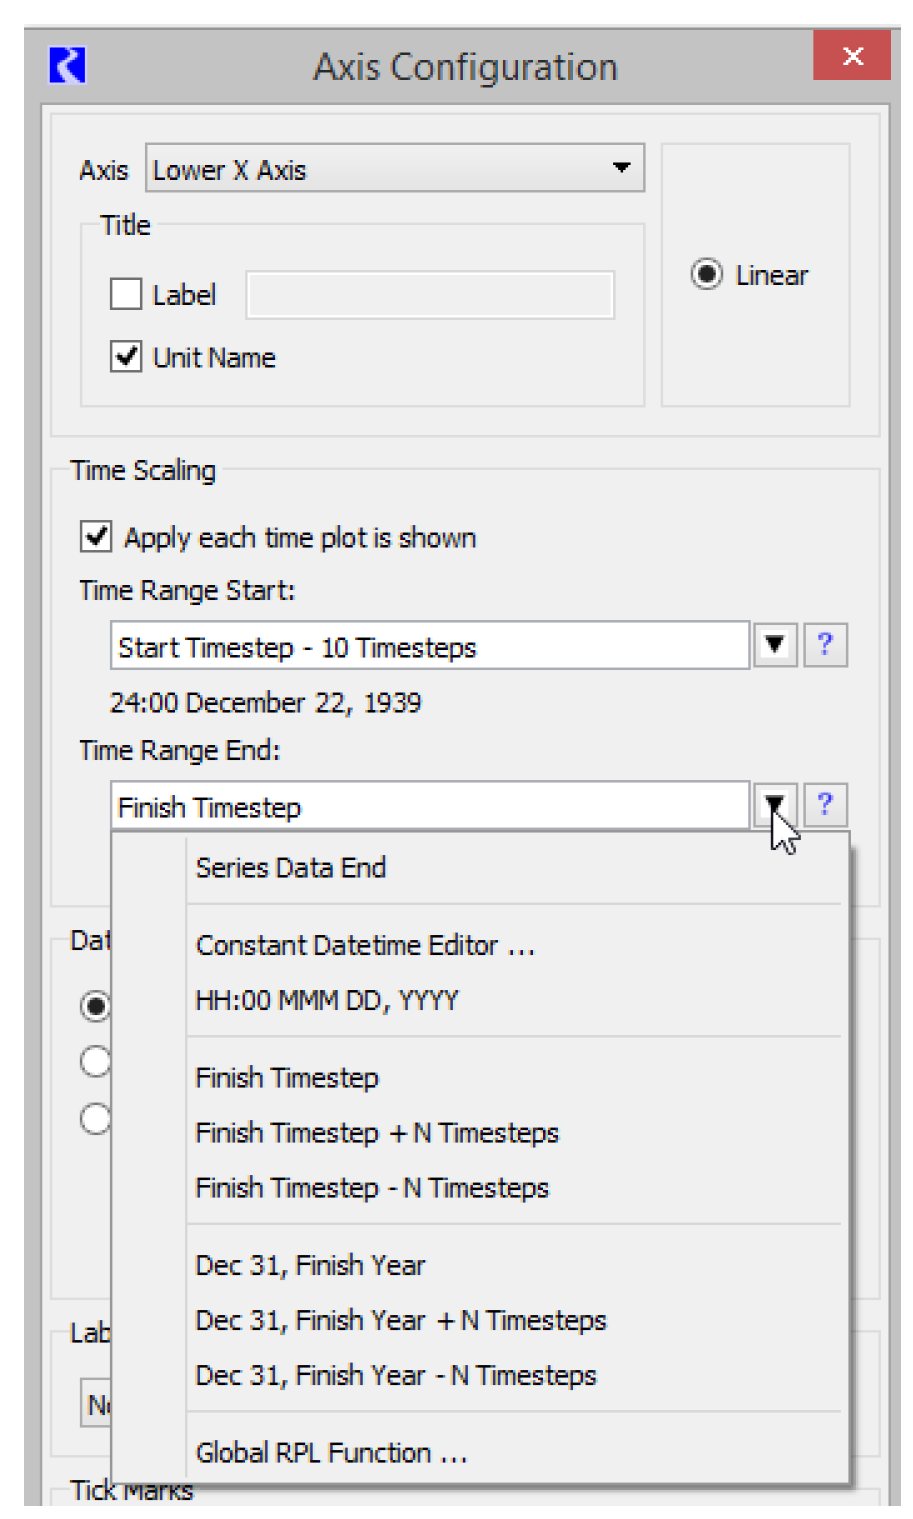
• Time axis configuration options support symbolic dates, for example, Run Start or Finish, plus or minus a specified number of timesteps or basic time units. In addition, any fully specified RPL datetime or global RPL datetime function can be specified. The screenshot to the right shows the axis configuration with time options shown.
• A new time scaling operation (T button,  , and Plot menu operation) sets the time range of a graph to the configured datetimes.
 , and Plot menu operation) sets the time range of a graph to the configured datetimes.
• There is an option to automatically apply this configured time scaling to a graph each time the graph is shown.
• The default axis preferences also support this time scaling setting, to be applied to newly created graphs. This replaces a simpler default configuration provision which provided two choices for the initial time range of newly created graphs.
• The Scale to specified time range toolbar button (S button,  ) now has a shift-click option. When the button is shift-clicked, all open plot dialogs brought to the front and are synchronized to the specified time range of the clicked plot dialog.
 ) now has a shift-click option. When the button is shift-clicked, all open plot dialogs brought to the front and are synchronized to the specified time range of the clicked plot dialog.
More information is available Time Series Axis in Output Utilities and Data Visualization
Tabular Series Slot Reports - Environment Variables
You can now use environment variables in Tabular Series Slot Report file specifications. For more information, see Output Tab in Output Utilities and Data Visualization.
Revised: 01/10/2025