
Configuring Model Reports
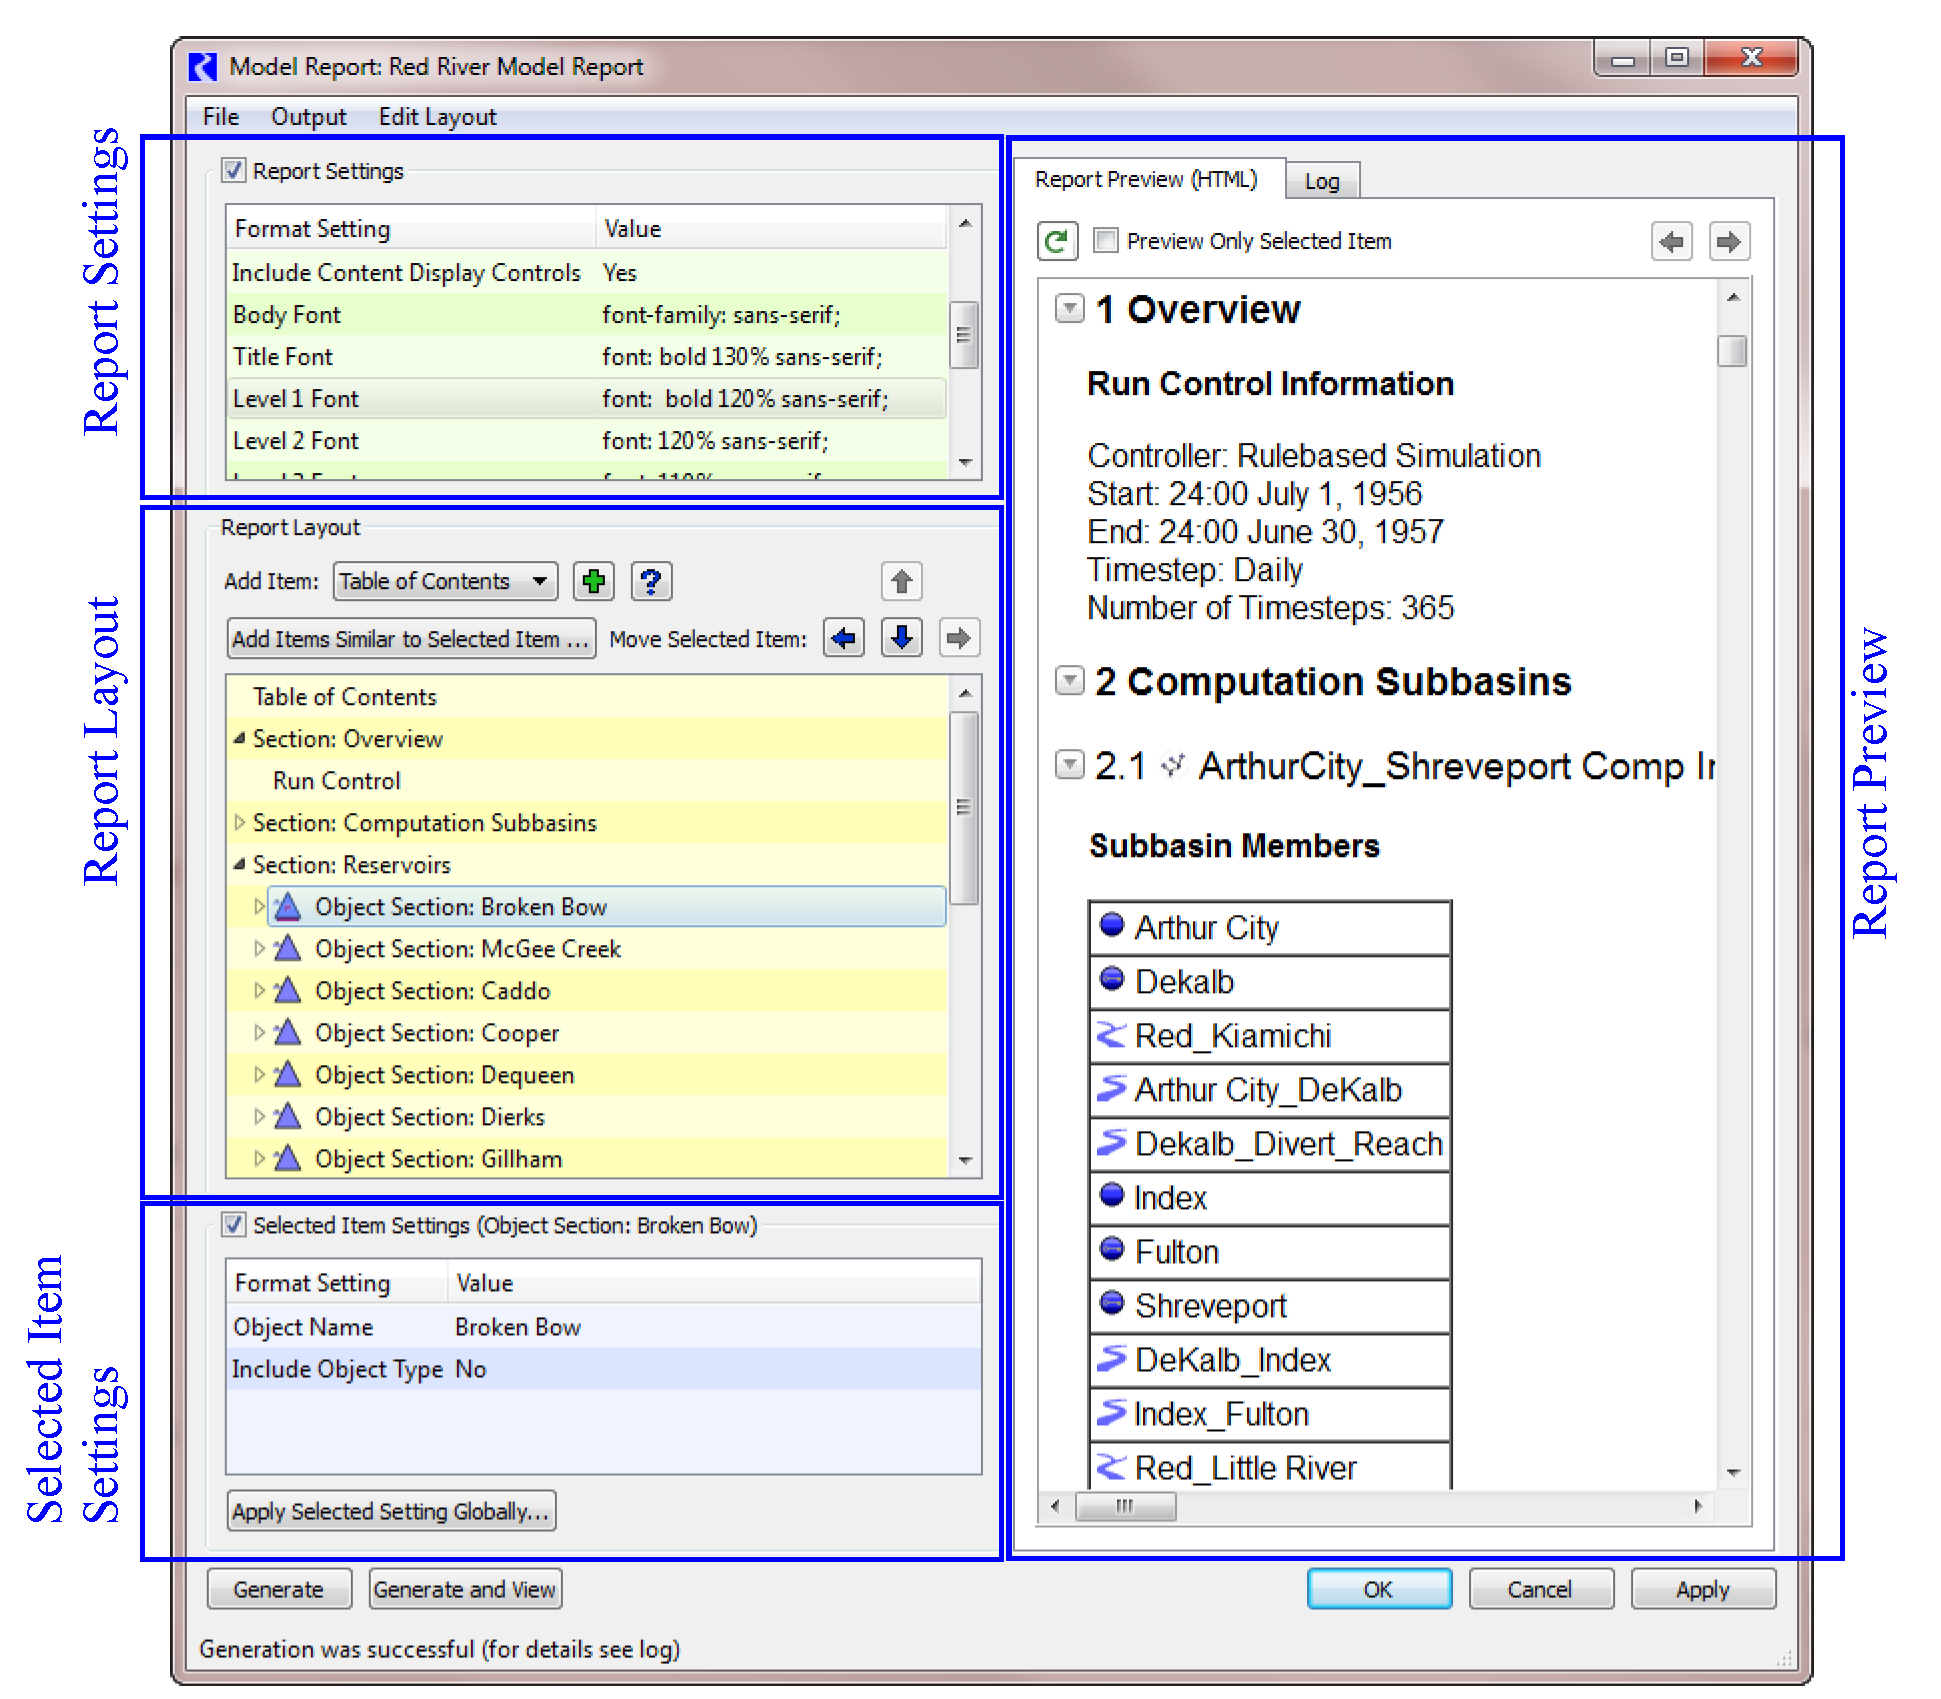
The Model Report configuration dialog allows you to create or change a report. It consists of the following areas, as shown in Figure 4.1.
• Report Settings. Aspects of the configuration which apply to the entire report, e.g., the name of the report, the output file name, and the overall appearance of the output file.
• Report Layout. Specification of the content to be included in the report, as well as the ordering and sectional organization of that content.
• Selected Item Settings. Control of the report formatting as specified on a per-item basis.
• Report Preview. View the report in a simplified HTML browser to quickly see what it will look like. Preview the entire report or a selected section.
In the remainder of this section, each of these areas is described in more detail.
Figure 4.1
In general, to create a new report, start with the Report Settings, then use the Report Layout to define what you want to have in the report. Use the Selected Item Settings to configure each item in the report. Refresh the preview as needed to get an idea of what the report will look like. For long reports, select the Preview Only Selected Item checkbox (see Report Preview Tab) to only show the selected portion of the report. If you plan to have similar sections for multiple objects, fully configure the section for one object, then select Add Items Similar to Selected Item to create sections for all other objects. See Report Layout Area for details.
Report Settings Area
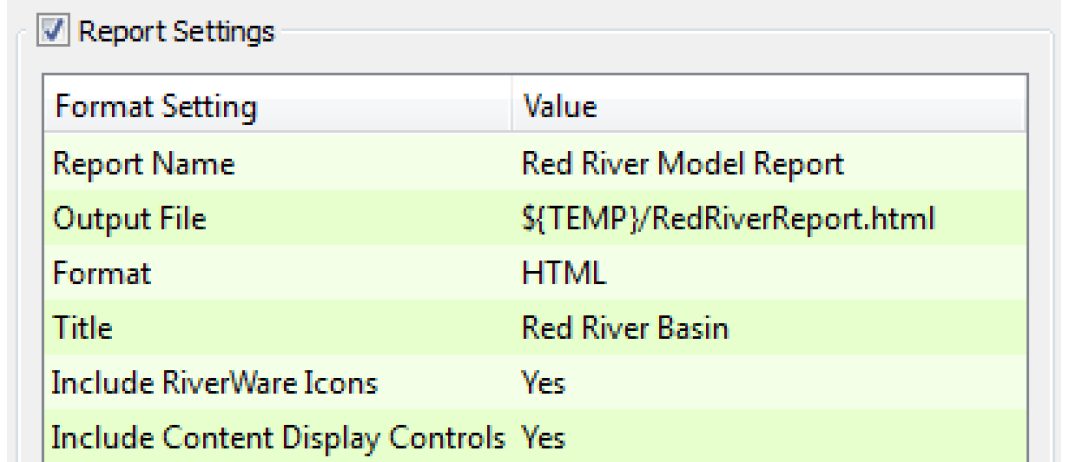
The Report Settings area displays settings which apply to the entire model report. There is one row for each setting, presented by name and value. To change a setting’s value, select the appropriate value cell, enter the new value and hit return (or select outside the editing window). When appropriate for the particular type of value being edited, a More (ellipsis) button is displayed next to the cell; selecting More will bring up a dialog to assist with the editing process. For example, when entering the name of an file, the button brings up a file chooser.
The following report settings are currently supported:
• Report Name. The name of the output device as displayed in the Output Manager dialog.
• Output File. The name of the file to which the report should be written. This should typically be a fully specified path (e.g., C:\Reports\MyReport.html) but may contain references to environment variables (e.g., ${REPORT_DIR}\MyReport.html). Within the file chooser, and html/htm filter is available. In addition, “.html” will be automatically appended to the file name, if not specified.
• Title. The title of the report. If provided, this text will appear at the top of the report.
• Include RiverWare Icons. If “Yes”, then references to workspace objects in the report will be accompanied by the appropriate RiverWare icon. When the report is generated, the image files corresponding to these icons will be written to a subdirectory at the same level as the output file. For example, if the output file is “C:\Reports\MyReport.html, then the images will be written to the directory C:\Reports\RiverWareReportImages, which is created by RiverWare as necessary.
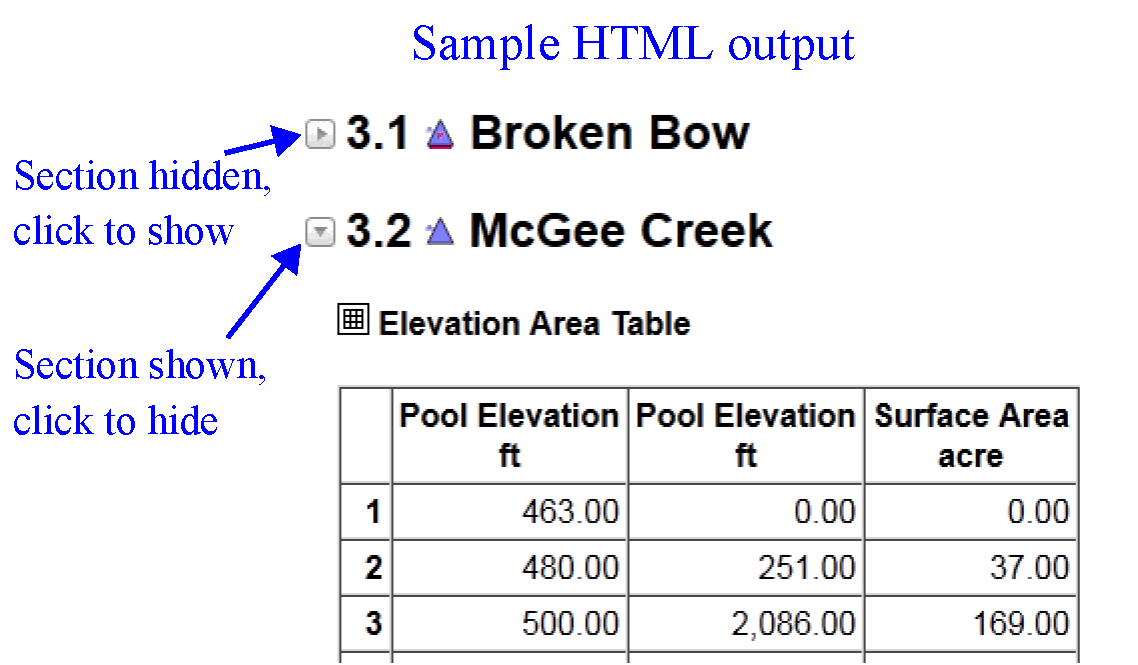
• Include Content Display Control. If “Yes”, the generated HTML file will include hide/show controls to the left of each section. These controls allow you to hide or show that section’s content.
Note: The HTML display must support Javascript.
• Embed Images in HTML File. If “Yes” (the default), any images included or generated by the report are embedded in the HTML file. For example If “No”, any images are included in the RiverWareReportImages folder. Embedded images make it easier to email or upload a HTML report. Non-embedded images allow for all the images to be organized separately and minimizes the size of the output HTML file.
Note: Not all applications support the display of images embedded within HTML documents. For example, while most browsers support this feature of HTML, Microsoft Word 2016 does not, so use of this feature can make the report less portable.
• Body Font. The font used for text in the body of the report. This and other fonts are specified in font declaration format used by cascading style sheets (CSS). The specification can be edited in line, or selected with a font chooser.
• Title Font. The font used for the report title.
• Level 1 Font. The font used for top level section titles.
• Level 2 Font. The font used for second level section titles.
• Level 3 Font. The font used for third level section titles.
• Level 4 Font. The font used for fourth level section titles.
• Level 5 Font. The font used for fifth level section titles
• Include Date In Output File Name. If enabled, each occurrence of the string “DATE” in the output file name will be replaced with the current date (in the ISO 8601 extended format, YYYYMMDD).
• Include Time In Output File Name. If enabled, each occurrence of the string “TIME” in the output file name will be replaced with the current time (in the ISO 8601 format, HHMMSS).
Once editing of the report settings is complete, the Report Settings area can be hidden by clearing the associated checkbox.
Report Layout Area
You control the content of the report in the Report Layout area. This content is organized by items, and you specify the report contents by indicating which items should be included, the order in which these items should appear, and their organization into sections. Select  for a description of each item, which is similar to the information in Table 4.1.
for a description of each item, which is similar to the information in Table 4.1. Item | Description |
|---|---|
Lists the sections in the report, with hyperlinks to their locations. | |
Lists the information contained in the Model Info dialog (accessed from the workspace using File, then Model Info), including the model’s save history and the specified comments. | |
Lists the information on the accounting system including range, accrual date, water types, owners, etc. This is the information shown in the Accounting, then Account System Configuration dialog. | |
Shows the information contained in the single run control dialog, including the controller, start and end dates, and timestep size. | |
Shows status information about the last run including version, user, controller, start time, duration, and completion status. | |
Presents a titled section whose contents are controlled by the items in the section. | |
Creates a section for a workspace object, whose title is the name of that object and whose contents are controlled by the items in the section. | |
Shows a slot’s name, description, and values. For, table, periodic and scalar slots, the values are shown. For series slots, a plot of the time series is shown. For Expression Slots, the RPL expression is shown along with a plot (series) or value (scalar). | |
Presents a table showing the name and a single value for one or more selected slots. Each row of the table is a slot. Columns include the Slot, Object (optional), Account (optional), Value, and Units. | |
Presents a table showing a grid of scalar slot values. The rows of the table represent objects while the columns represent one or more named scalar slots. | |
Shows a table where the rows represent the time intervals of a periodic slot and the columns represent the columns in one or more periodic slots. These are used to display periodic slots that have only one column. | |
Displays a table of the method categories and the selected method in each category. When accounting is enabled, this table includes Object Level Accounting Methods. | |
Displays a section describing an account on the workspace. The title is the name of the account. Sub-sections can be added to an account section. | |
Presents a table with a list of accounts (often those for a single simulation object) and optional columns for several account attributes including type, water type, water owner, and priority date. | |
Presents a table of supplies and optional columns for supply attributes including type, release type, and destination. | |
Displays a table with an account’s method categories and the selected method in each category. Note: These are account level methods, not object level methods. | |
Shows a table of the members of a subbasin. | |
Presents a table of the physical links to slots on the specified object, optionally limited to links to the slots on a second specified object. | |
Prints user defined text. The text can be Plain Text or Rich Text which allows formatting. | |
Shows an Image imported from a file. An optional caption setting is provided. | |
Displays a section for each policy and utility group in a RPL set. | |
Displays a section for a single policy or utility group in a RPL set. | |
Displays a section for a single RPL item (Rule/Goal/Accounting Method). | |
Shows a single top-level RPL Statement within a RPL Block (a Rule, Goal, User-Defined Accounting Method or Initialization Rule). | |
Displays an image of an existing plot page output device. Use the Plot Page’s timesteps or override with an optional setting. | |
Displays an image of an existing Chart output device. Use the configured timestep or override with an optional setting. | |
Displays an image of an existing Output Canvas device.Use the configured timestep or override with an optional setting. See Output Canvas for additional information. | |
Displays an existing Tabular Series Slot Report output device in either HTML or text format. The title defined within the Tabular Series Slot Report is extracted from the report and presented as a report item title text within the generated Model Report. Use the configured timesteps or override with an optional setting. |
The following operations allow you to create the report layout and arrange its items as desired.
Button | Description |
|---|---|
Add Item  | Use the menu to chose an item to add to the layout. Then select Plus  to add the selected item. The new item is added below the currently selected item, either at the same sectional level or as a child of the selected item, as appropriate for the types of the new and selected items. (If the new item is not initially in the desired location, it can be moved as discussed below.) A similar action can be accomplished by selecting Edit Layout, then Add Item, and then choosing the desired item type. to add the selected item. The new item is added below the currently selected item, either at the same sectional level or as a child of the selected item, as appropriate for the types of the new and selected items. (If the new item is not initially in the desired location, it can be moved as discussed below.) A similar action can be accomplished by selecting Edit Layout, then Add Item, and then choosing the desired item type. |
Add Items Similar to Selected Item  | When an item associated with an object is selected, this button is enabled. When this button is selected, you can use the object selector to select multiple objects. A copy of the selected report item is made for each selected object, with the original object reference replaced with the object selection. For example, if an Object Section item associated with Reservoir A is currently selected and this button is selected, then you select Reservoir B and Reservoir C, then two new Object Section items will be added. Each will be identical to the Reservoir A item except that all references to Reservoir A in one will be replaced with references to Reservoir B, and similarly, Reservoir A references will be replaced with Reservoir C references in the other item. |
Move arrows 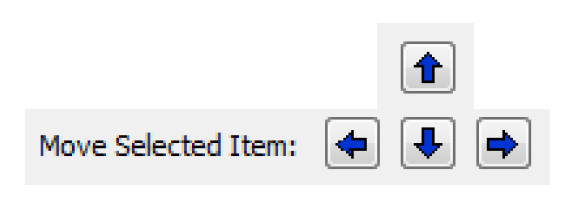 | These buttons can be used to move the selected item up or down or to change the sectional organization by making an item a child of item above it (right arrow, make child, or “move in”) or a sibling of the parent item (left arrow, Promote, or “move out”). |
Drag and drop | An item can be dragged from one location to another to move it, or it can be dragged from the Report Layout of one model report configuration dialog to that of another dialog to add a copy. |
Edit operations | The following standard edit operations can be accessed via the right-click context menu or the Edit Layout menu: Cut, Copy, Paste, Delete. In addition the Edit Layout menu provides the Paste Below Selected Item which adds the buffered item as a new item instead of overwriting the selected item. Initially section items are displayed collapsed; in addition to individually collapsing and expanding the contents of section items in the Report Layout, the right-click context menu provides the Expand All and Collapse All options. |
Selected Item Settings Area
The Selected Item Settings area allows you to control the appearance of individual report items. This area lists the settings which apply to the item currently selected in the Report Layout area, and allows them to be edited by selecting the current setting value. See Report Items Reference for details about the settings that apply to each type of report item.
Text Considerations
Newly created Text Items are in the Rich Text mode by default. When in this mode, an advanced editor is shown for editing the text item content. This is initiated by selecting More after double-clicking the Text setting's value field
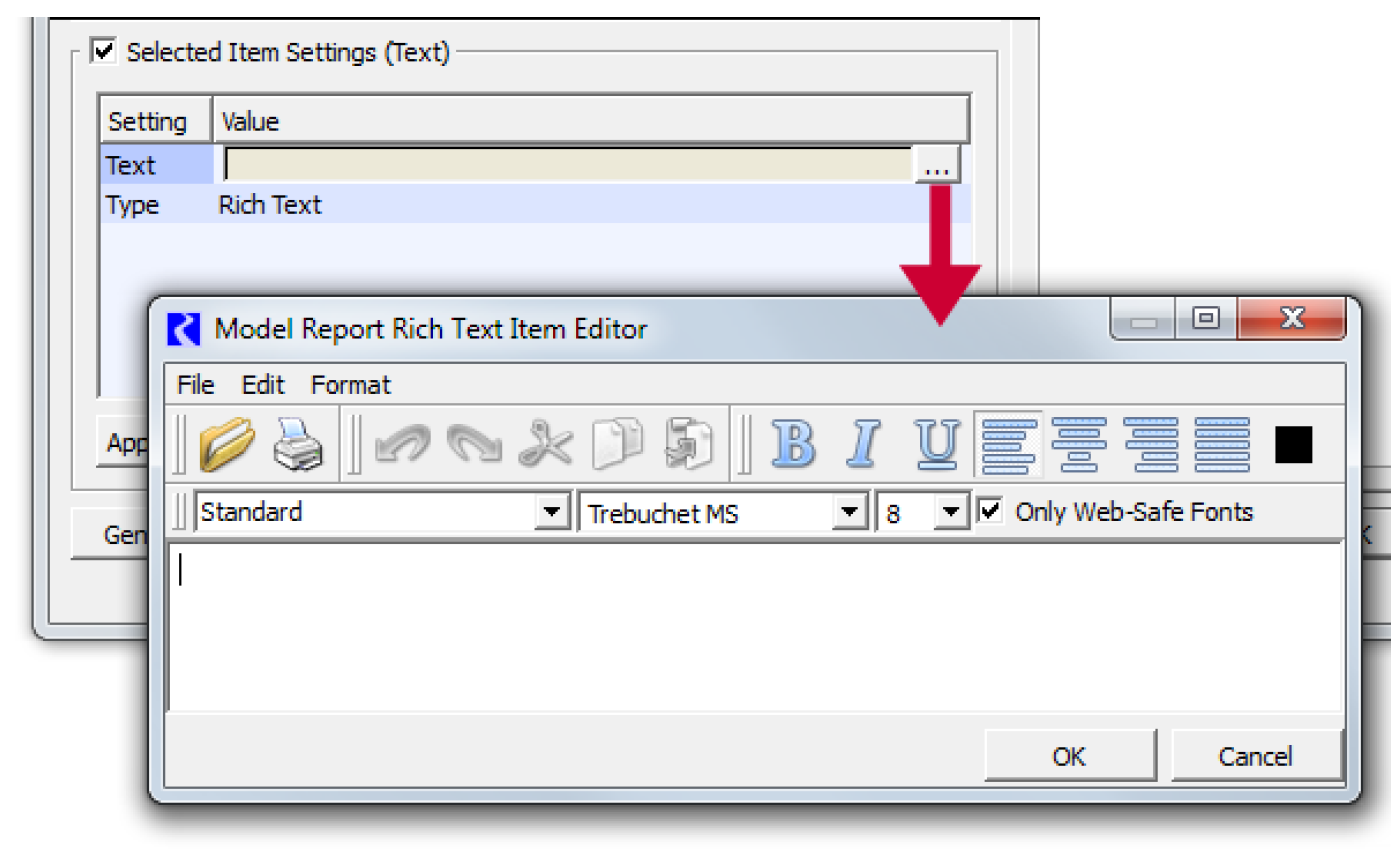
The Rich Text Item Editor supports many common formatting operations; these are generally applied to the selected portion of the text content. Options include bold, italics, underline, subscripts, superscripts, alignment (left, right or center), and text color.
Superscripts and subscripts can be applied from the Format menu. Superscripts and subscripts appear very small in the Rich Text Editor. But the Model Report editor's preview panel does represent superscripted and subscripted text accurately (as it would in a browser). There is no size reduction of the font in subscripts and superscripts. You may want to also reduce the size of, especially subscripts, by applying a smaller text size. In addition, there is no way to remove the super and subscripts. Delete and re-enter text that you wish to have normal formatting.
In general, tabs are not supported in HTML documents. To work around this, the tab key in the Rich Text Editor results in four non-breaking spaces in the generated HTML file. Shift-space bar results in 1 non-breaking space.
Copying and pasting basic formatted text content from an external application (e.g. a web browser, or Microsoft Word), using the system clipboard, is supported. Also, it is possible to Import an existing HTML or text document; doing so replaces the editor's prior content.
The editor supports Undo and Redo operations, so it is very reasonable to experiment with the available formatting operations. However, the graphical rendering by this editor doesn't precisely match the appearance of content in the generated HTML document. Formatting should be checked in the Model Report configuration dialog's preview panel after applying changes to rich text Text items.
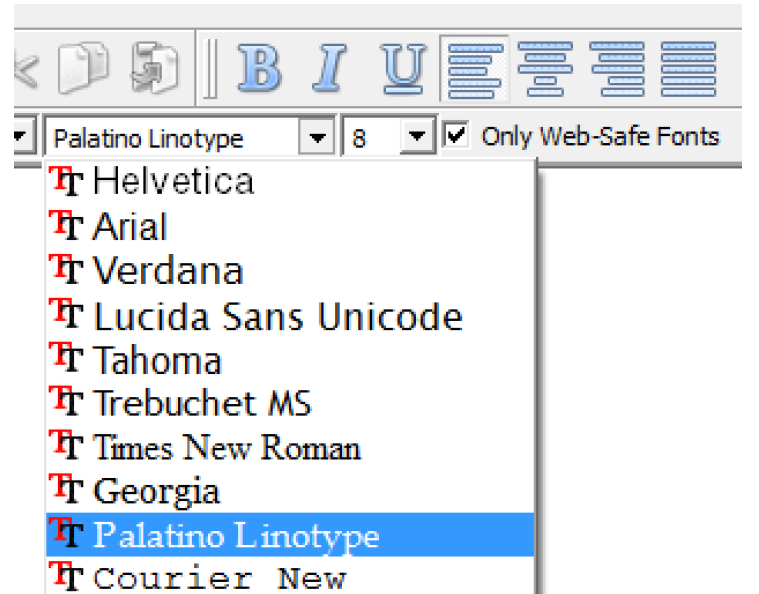
Any font on the user's system can potentially be applied to rich text content. (A typical Windows system supports over 300 different fonts). However, since the generated RiverWare Model Report is an HTML document, and since web browsers generally rely on the fonts available on the viewer's system, we recommend the use of the Only Web-Safe Fonts option which limits the font selection to fourteen of the most commonly supported fonts. This is selected by default.
Once rich text has been entered, switching back to “Plain Text” mode causes the loss of any formatting and text attributes which had been applied. For this reason, a confirmation dialog is presented to the user when switching to “Plain Text”.
Additional Setting Features
Following are additional features that apply to one or more item types and their settings.
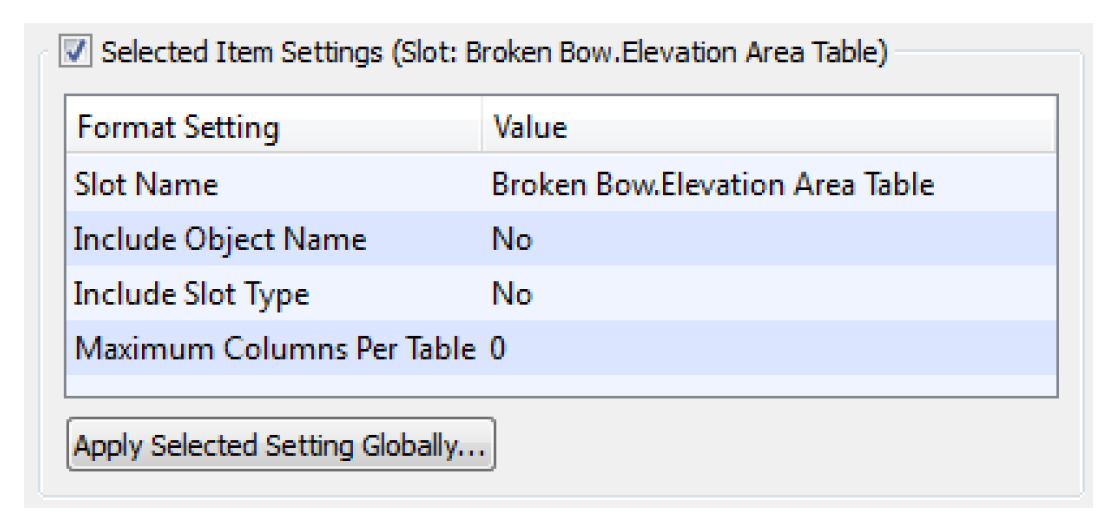
Apply Selected Setting
Globally Selecting Apply Selected Setting Globally will search the report layout for items that have a different value for the selected setting. If any such settings exist, then you will be asked to confirm that you would like to copy the selected setting’s value to these items, that is, to bring all of values for the selected setting into agreement.
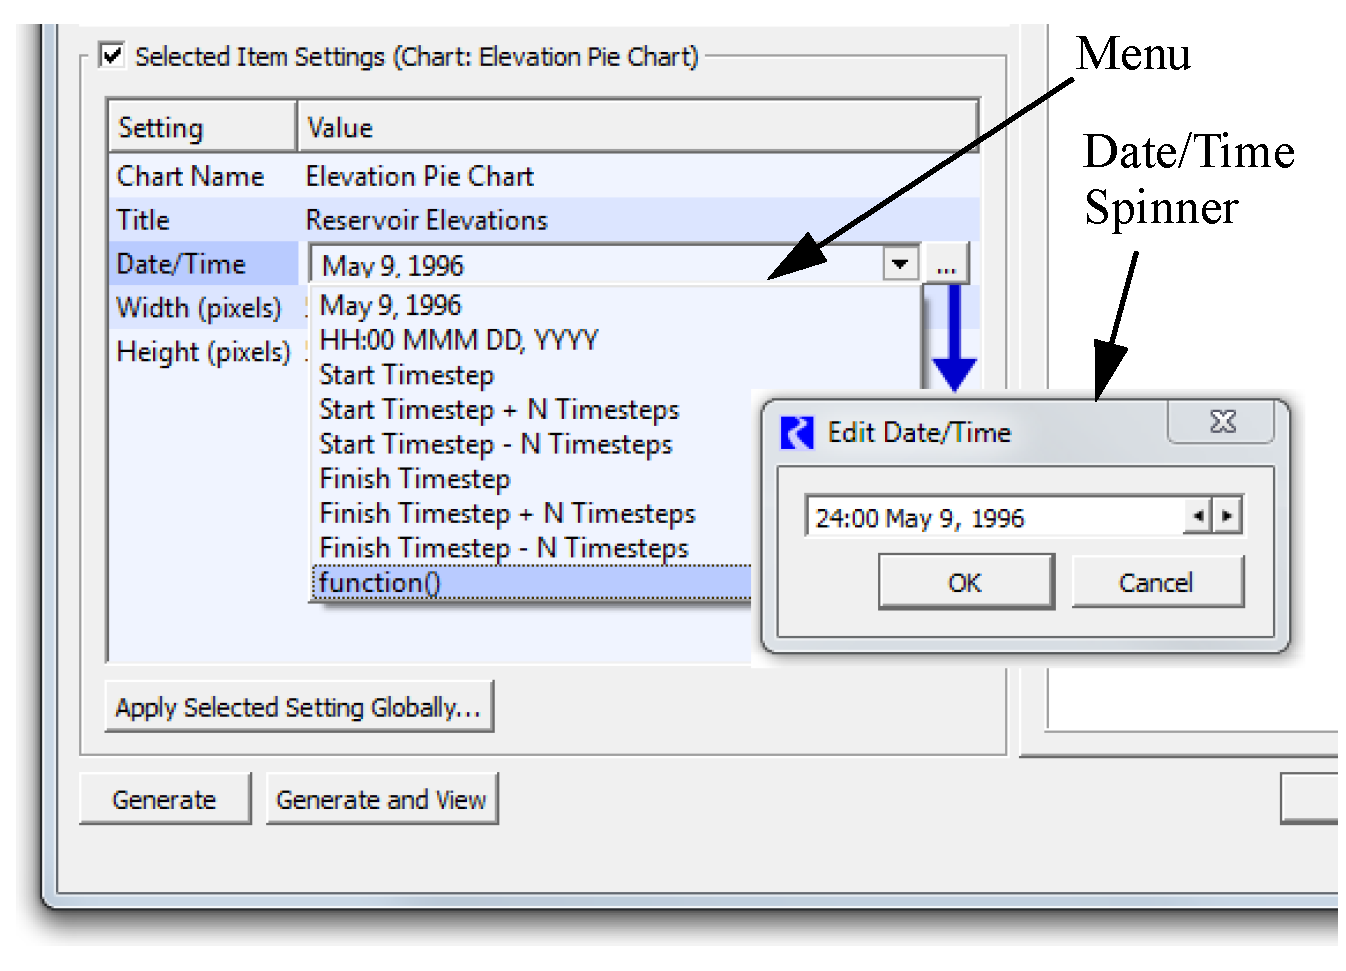
Date/Time Specification
Date/times can be specified as follows:
• Enter them explicitly by typing in the date.
• Specify by More  , which opens the Date/Time selector.
, which opens the Date/Time selector.• Use the menu, shown in Figure 4.2 to select one of the common formats. Then specify any of the pieces necessary like integers “N”, Hour (H), Minute (M), Day (D), Year (N). See DATETIME in RiverWare Policy Language (RPL) for details on Date/Time. Basically, any fully specified Date/Time can be used.
Note: No @ or quotes “ ” are necessary when specifying the Date/Time. Any errors in computation of the timestep are reported on the Log tab. See Log Tab.
• Use a Global Function. To allow additional flexibility specifying Date/Time, you can specify a RPL function from an opened Global Function Set. See Global RPL Functions in RiverWare Policy Language (RPL) for details. You must enter the name of the function in the form: function(). This function must meet the following requirements:
Return a fully specified DATETIME variable
Not have any arguments
Any errors in computation of the timestep are reported on the Log tab Log Tab.
• If you leave the Date/Time blank, then the default timestep for that setting is used. Typically this is the timestep(s) configured on the Output Device or the default run range.
Figure 4.2
Lists of Items
For the Periodic Slot Table and Scalar Slot Grid, you specify an ordered list of Objects, Slots and/or Slot Names. This ordered list is specified in a separate dialog called the Edit <Item> List as shown in Figure 4.3. Select Add to open the selector in the appropriate mode and select the desired items.
Figure 4.3
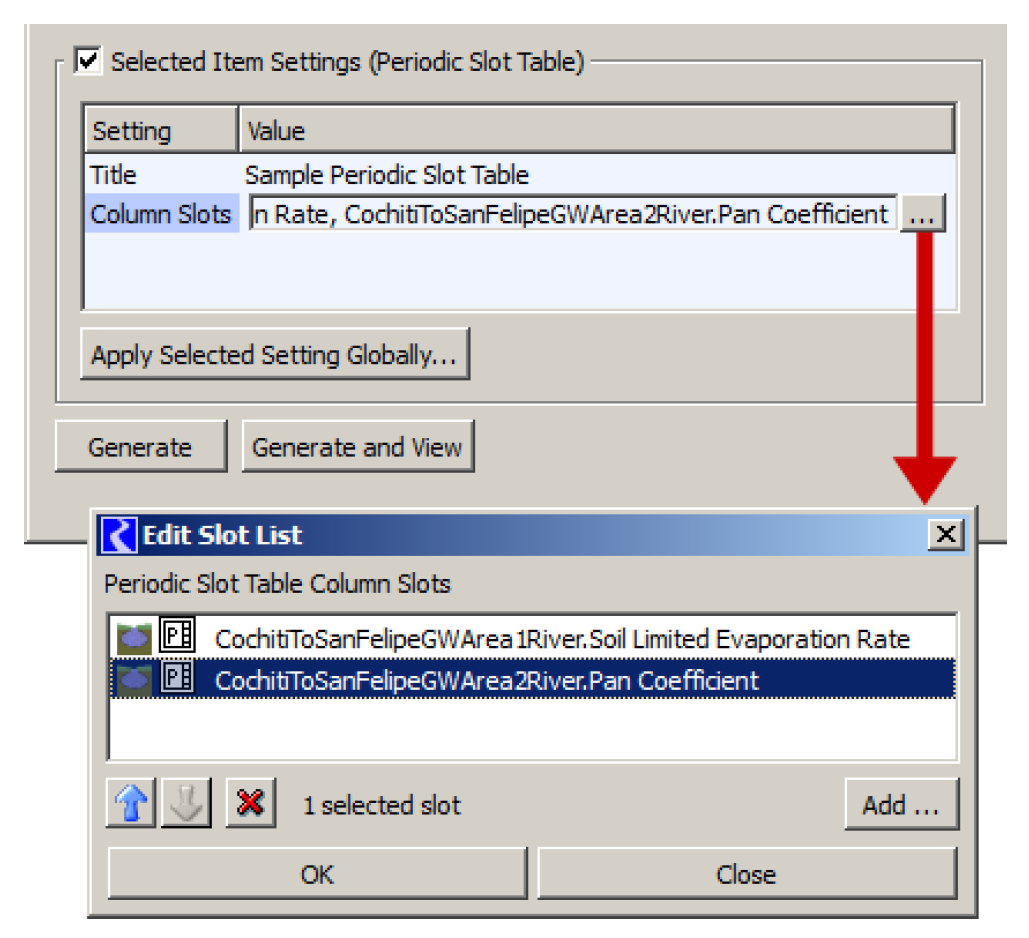
Use the blue arrows to rearrange the items in the list. This ordering is preserved in the model report. Use the red X to delete the item.
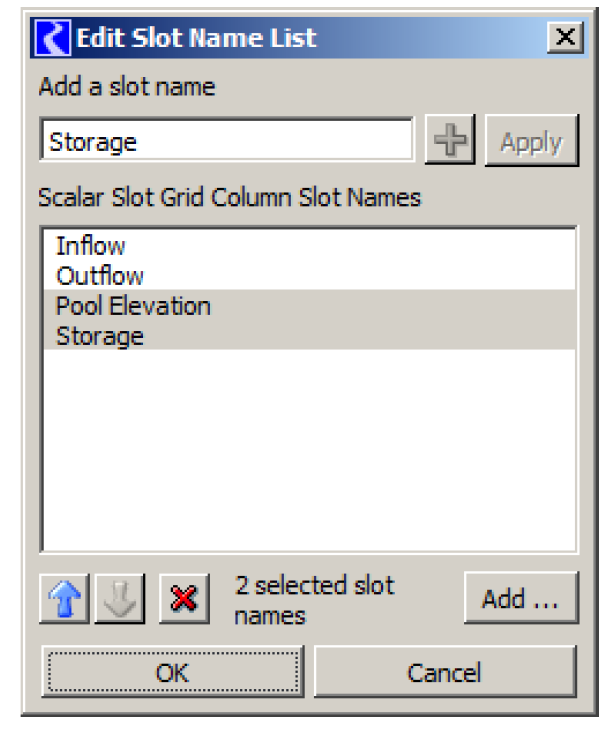
For the Scalar Slot Grid, you specify names of slots, not specific slots on objects. In this mode, the slot name can be typed into the box at the top of the dialog (as shown in Figure 4.4) or chosen from the selector by selecting Add. The list preserves only the Name of the slots.
Figure 4.4
Report Preview Tab
The first tab of the panel on the right side of the dialog provides a preview of what the output report will look like in an external application. Selecting Refresh  will generate output corresponding to the current layout and settings. Checking the Preview Only Selected Item will display only the output generated by the item selected in the Report Layout area. This setting is very useful for long reports where you only want to preview a small portion.
will generate output corresponding to the current layout and settings. Checking the Preview Only Selected Item will display only the output generated by the item selected in the Report Layout area. This setting is very useful for long reports where you only want to preview a small portion.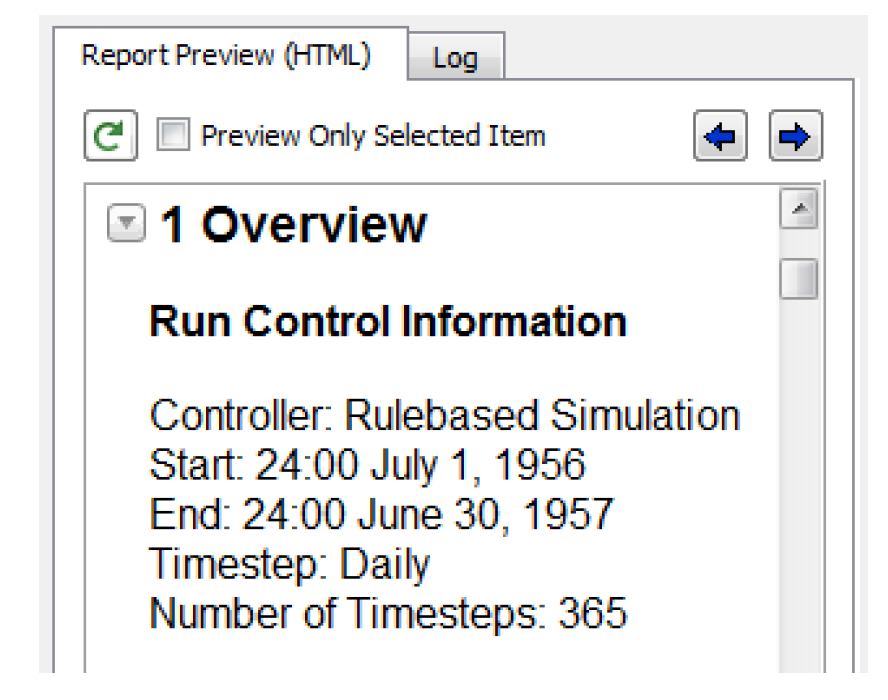
Previous and Next arrows  provide navigation backwards and forwards to locations in the document which have been visited by selecting a link.
provide navigation backwards and forwards to locations in the document which have been visited by selecting a link.Note: Many applications are capable of displaying an HTML document (e.g., this panel of RiverWare, Mozilla Firefox web browser, and Microsoft Word editor), but different applications often display the same HTML differently. It is always a good idea to test your model report in a range of browsers to ensure it looks reasonable.
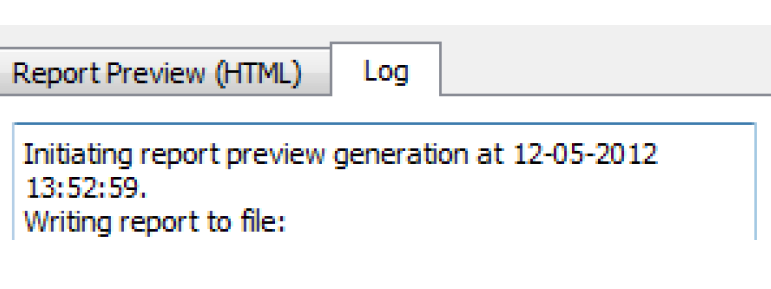
Log Tab
This tab provides a textual description of the report generation process. The log contains details such as: the time at which generation began and ended, the output file path, the directory to which image files were written, and how many new images were written there. When a problem occurs during preview generation, the details will be reported here (and typically not in the diagnostic dialog). If the preview does not looks as expected, the log will often explain problems encountered.
Additional Buttons and Menu Actions
Following are descriptions of the remaining buttons and menu actions:
• Generate: Select Generate to create the model report output file in the path specified by the Output File setting.
• Generate and View: Generate the report and open the file using the program specified by selecting Output, then File Type Associations.
• OK: Select OK to save any unapplied changes and close the configuration dialog.
• Cancel: Select Cancel to discard any unapplied changes and close the configuration dialog.
• Apply: Select Apply to save to the Output Manager any changes since the last apply.
Note: For these changes to be reflected in the model file, a separate model file save is required.
Select File, then Export to create a file containing the model report configuration. This file can then be imported via the Output Manager into another model.
Revised: 08/04/2020