
Plot Page Navigation
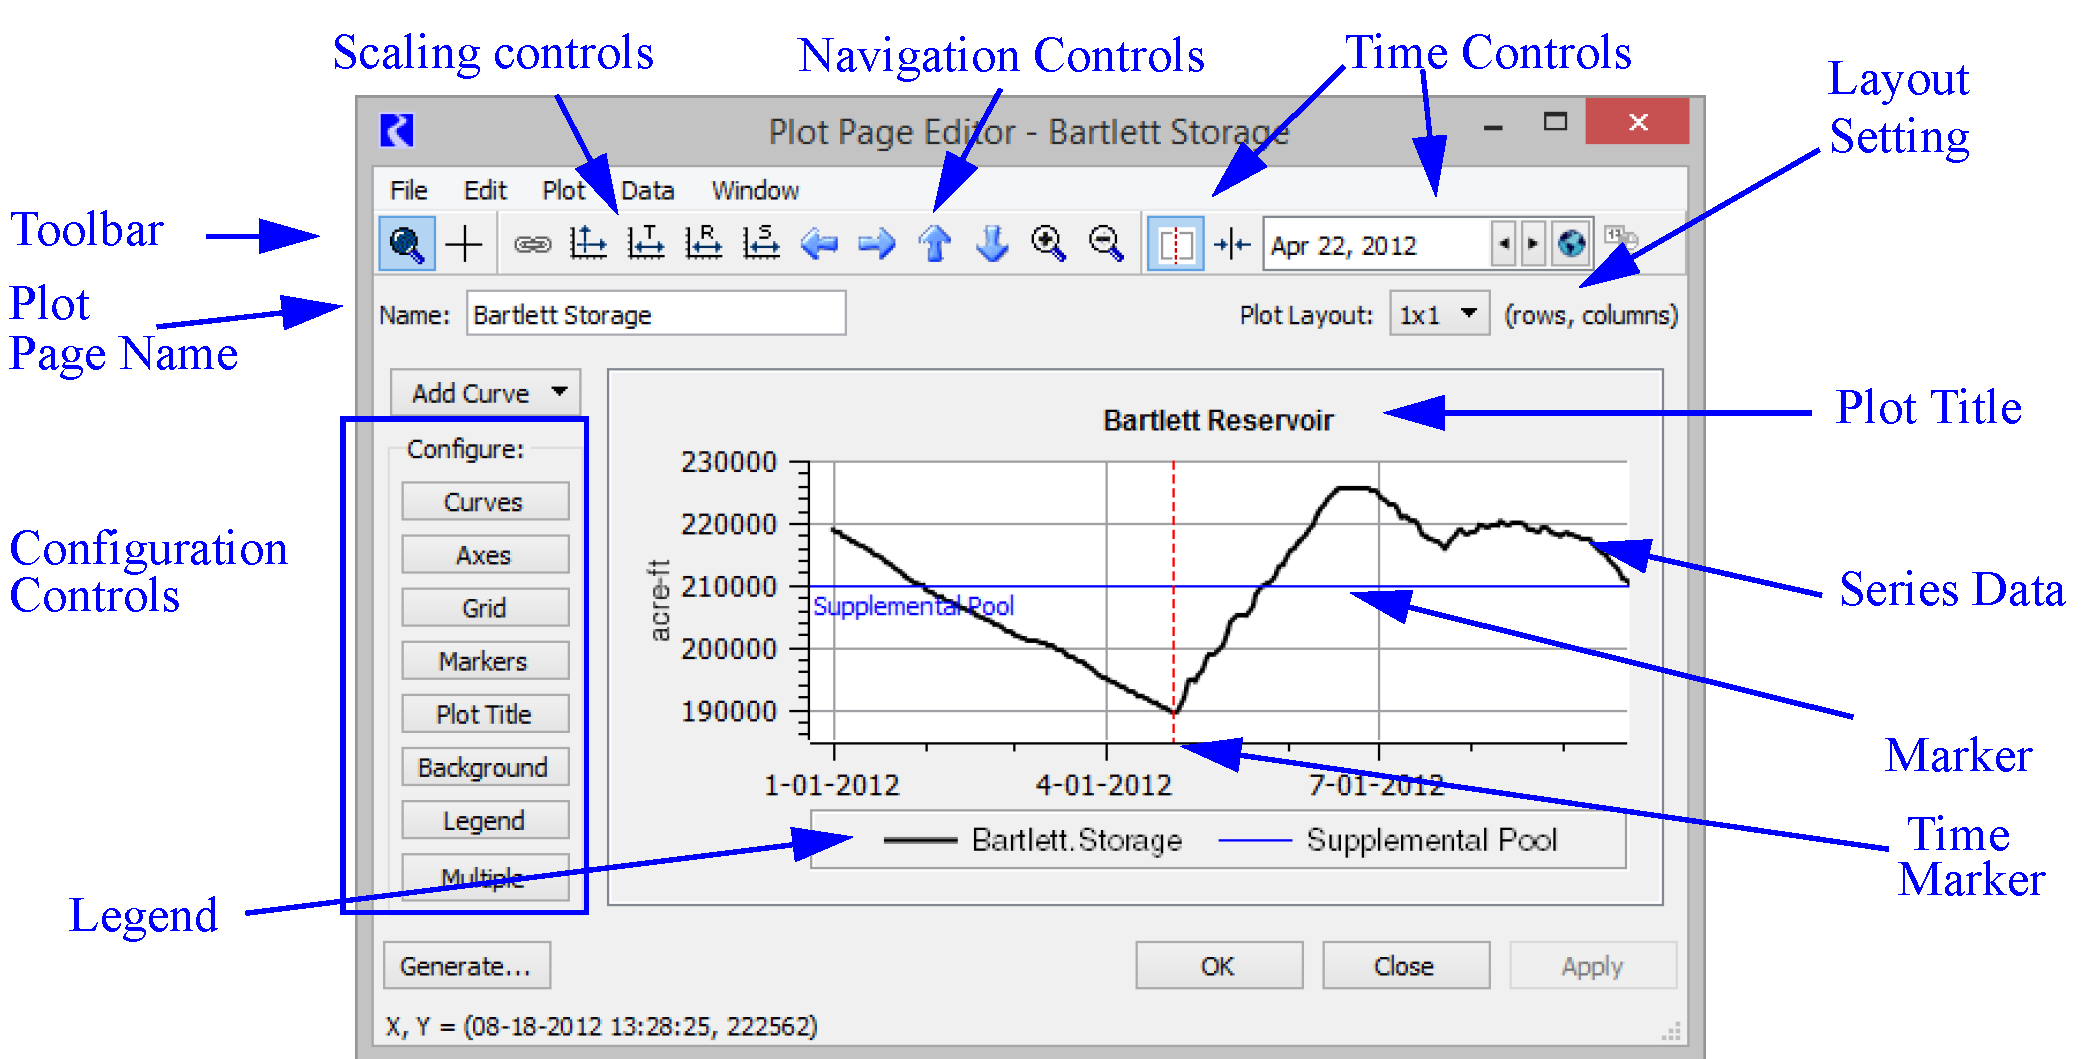
Following are common actions used to navigate, scale, and otherwise view a plot in both the Plot Page and Plot Page Editor. Figure 2.26 shows a sample Plot Page Editor dialog.
Figure 2.26 Plot Page Editor dialog box
Toolbar Actions
Following is a description of the toolbar buttons. Use these buttons to scale, zoom, and navigate through the plot. These buttons apply for both the Plot Page Editor and the Plot Page dialog.
Button | Description |
|---|---|
Mouse Zoom/ Mouse Recenter 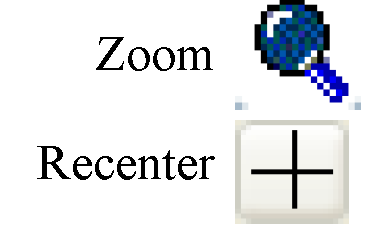 | The Zoom tool displays a magnifying glass cursor icon, which lets you select a zoom rectangle by click-and-dragging the mouse. The Recenter tool displays crosshairs as a mouse icon and causes the plot to be centered around the point at which the mouse is selected. |
Link Plots  | If there is more than one plot in the Plot Page, the Link Plots tool is active, letting you do manipulation operations on all of the plots in unison (including AutoScale, the Shift Tools, the Zoom Tools, Date Spinner, and Date Center). |
Auto-Scale 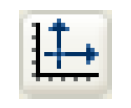 | The Auto-Scale feature scales and translates the plot(s) to include the entire range of data. |
Apply Configured Time Scaling 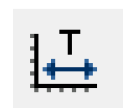 | The Apply Configured Time Scaling feature scales and translates the plot(s) to the range specified in the Axis Configuration. This can be a symbolic or absolute time range. In addition, you can configure a plot to always use this configured time range when opening the plot. See Time Series Axis for additional information. This operation does not affect the y axis scaling. |
Scale to Run Range  | The Scale to Run Range scales the x axis to the run range defined on the Run Control. It is available only for times series plots. The y axis display is not affected. |
Scale to Specified Range  | The Scale to Specified Range scales the plot(s) to a range that you specify in the dialog. This operation does not affect the y axis scaling. When the button is shift-selected, all open Plot Page dialogs are raised to the top and the time range is synchronized to the specified time range of the selected plot. 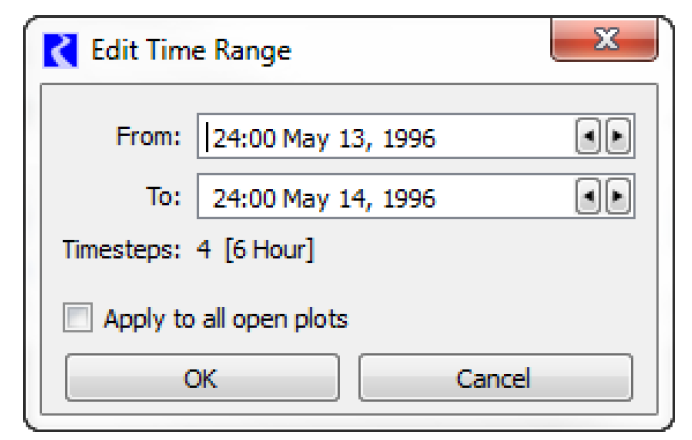 |
Zoom Tools  | The Zoom feature zooms in or out on the center of the plot dialog, on either the X, Y, or both axes. Use the middle mouse wheel to zoom in/out on either the plot area or independent axes. See Mouse Button Actions for additional information. |
Date Spinner  | The Date Spinner is used to scroll to a specified date. |
Date Center  | The Date Center icon is used in conjunction with the Date Spinner to center the plot on the specified date. |
Date Marker  | The Date Marker icon is used to show a red marker line at the specified date in the Date Spinner. This feature works in two ways. If the plot is showing the entire timeseries, i.e. it was auto-scaled using the Auto-scale  icon, the Date Marker will move to the specified date but the plot will not be re-centered. If the plot is not auto-scaled, i.e. it has been zoomed or panned, the Date Marker will center the plot on the specified date. icon, the Date Marker will move to the specified date but the plot will not be re-centered. If the plot is not auto-scaled, i.e. it has been zoomed or panned, the Date Marker will center the plot on the specified date. The line can be hidden or shown by selecting the button. The marker line will be shown on all linked plots, but not on unlinked plots. 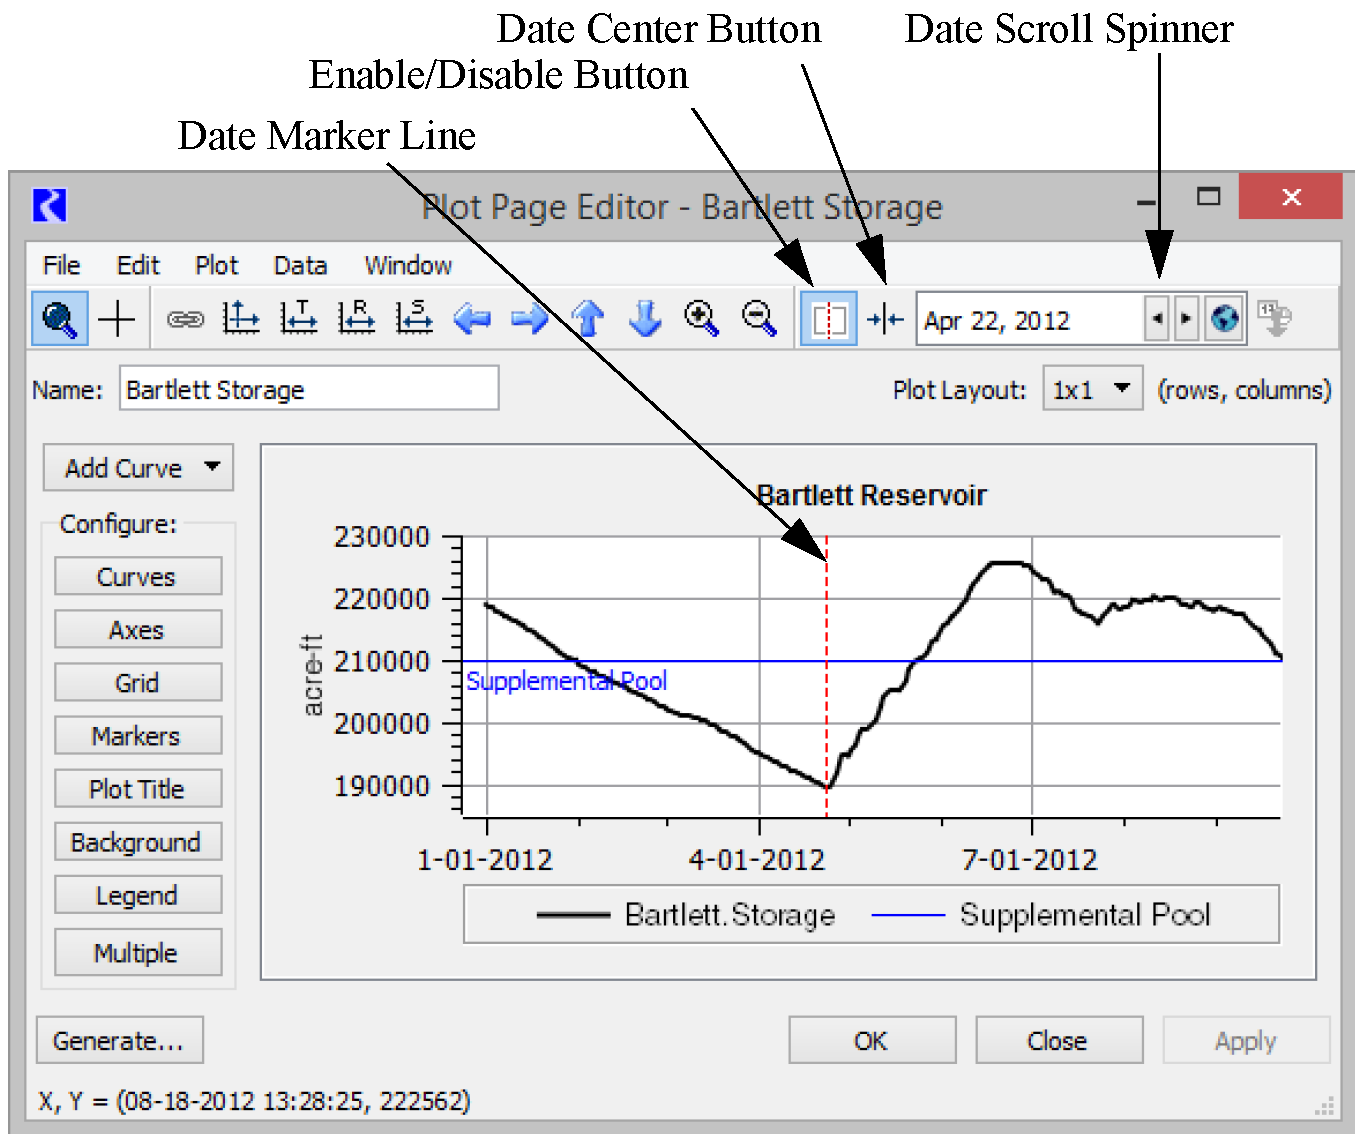 |
Sync Dates  | The Sync Dates feature syncs the dates on all plots. If there is only one plot in the plot page, this function is not available. |
Legend | The legend shows the curves displayed in the plot. Select a curve name in the legend to temporarily hide that curve. Select again to show it The hidden/shown status is preserved within a RiverWare session but is not saved to the model file. All curves/markers are shown when the plot is first opened. Right-selecting the curve name will show a context menu with options to edit the curve configuration, remove from legend, reorder the legend, or to delete the curve. 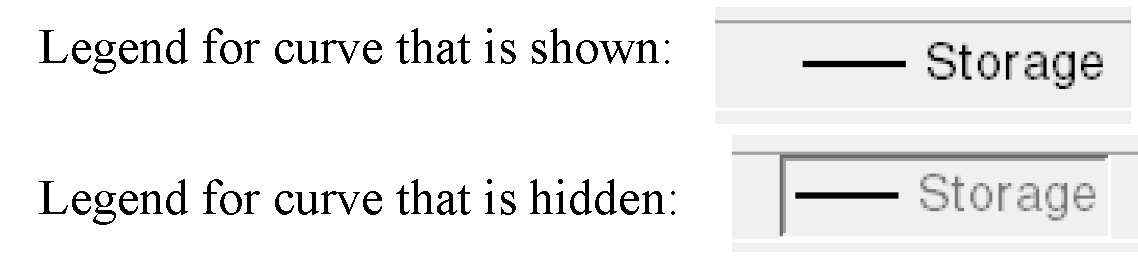 |
Mouse Button Actions
There are three special operations provided by the middle mouse button and/or wheel:
Mouse Wheel Plot Zoom
While the cursor is in the main plot area, use the mouse wheel to zoom both axes. The plot will remain centered during zooming operations regardless of cursor position.
Single Axis Plot Zoom
When the cursor is positioned over an axis, use the mouse wheel to zoom the plot in or out along only that axis. This single axis zoom also supports zooming independent Left or Right Y axes and Top or Bottom X axes.
Plot Panning
While the cursor is in the main plot area, click the middle mouse button/wheel to pan the plot in any direction. During panning, the cursor changes to a closed-hand shape to indicate panning is in progress.
Note: On some devices, the middle button is the wheel itself while on others, there may be a middle button separate from the wheel.
Revised: 08/04/2020