Script Dashboard
The Script Dashboard is the main interface for executing the script. This dialog box presents the actions and controls for the script, although not all actions are necessarily shown. See Editing a Script for details about configuring the settings for each action. Each row in the dashboard represents an action. Within each action, the action display text, optional action description, and any user controls are presented.
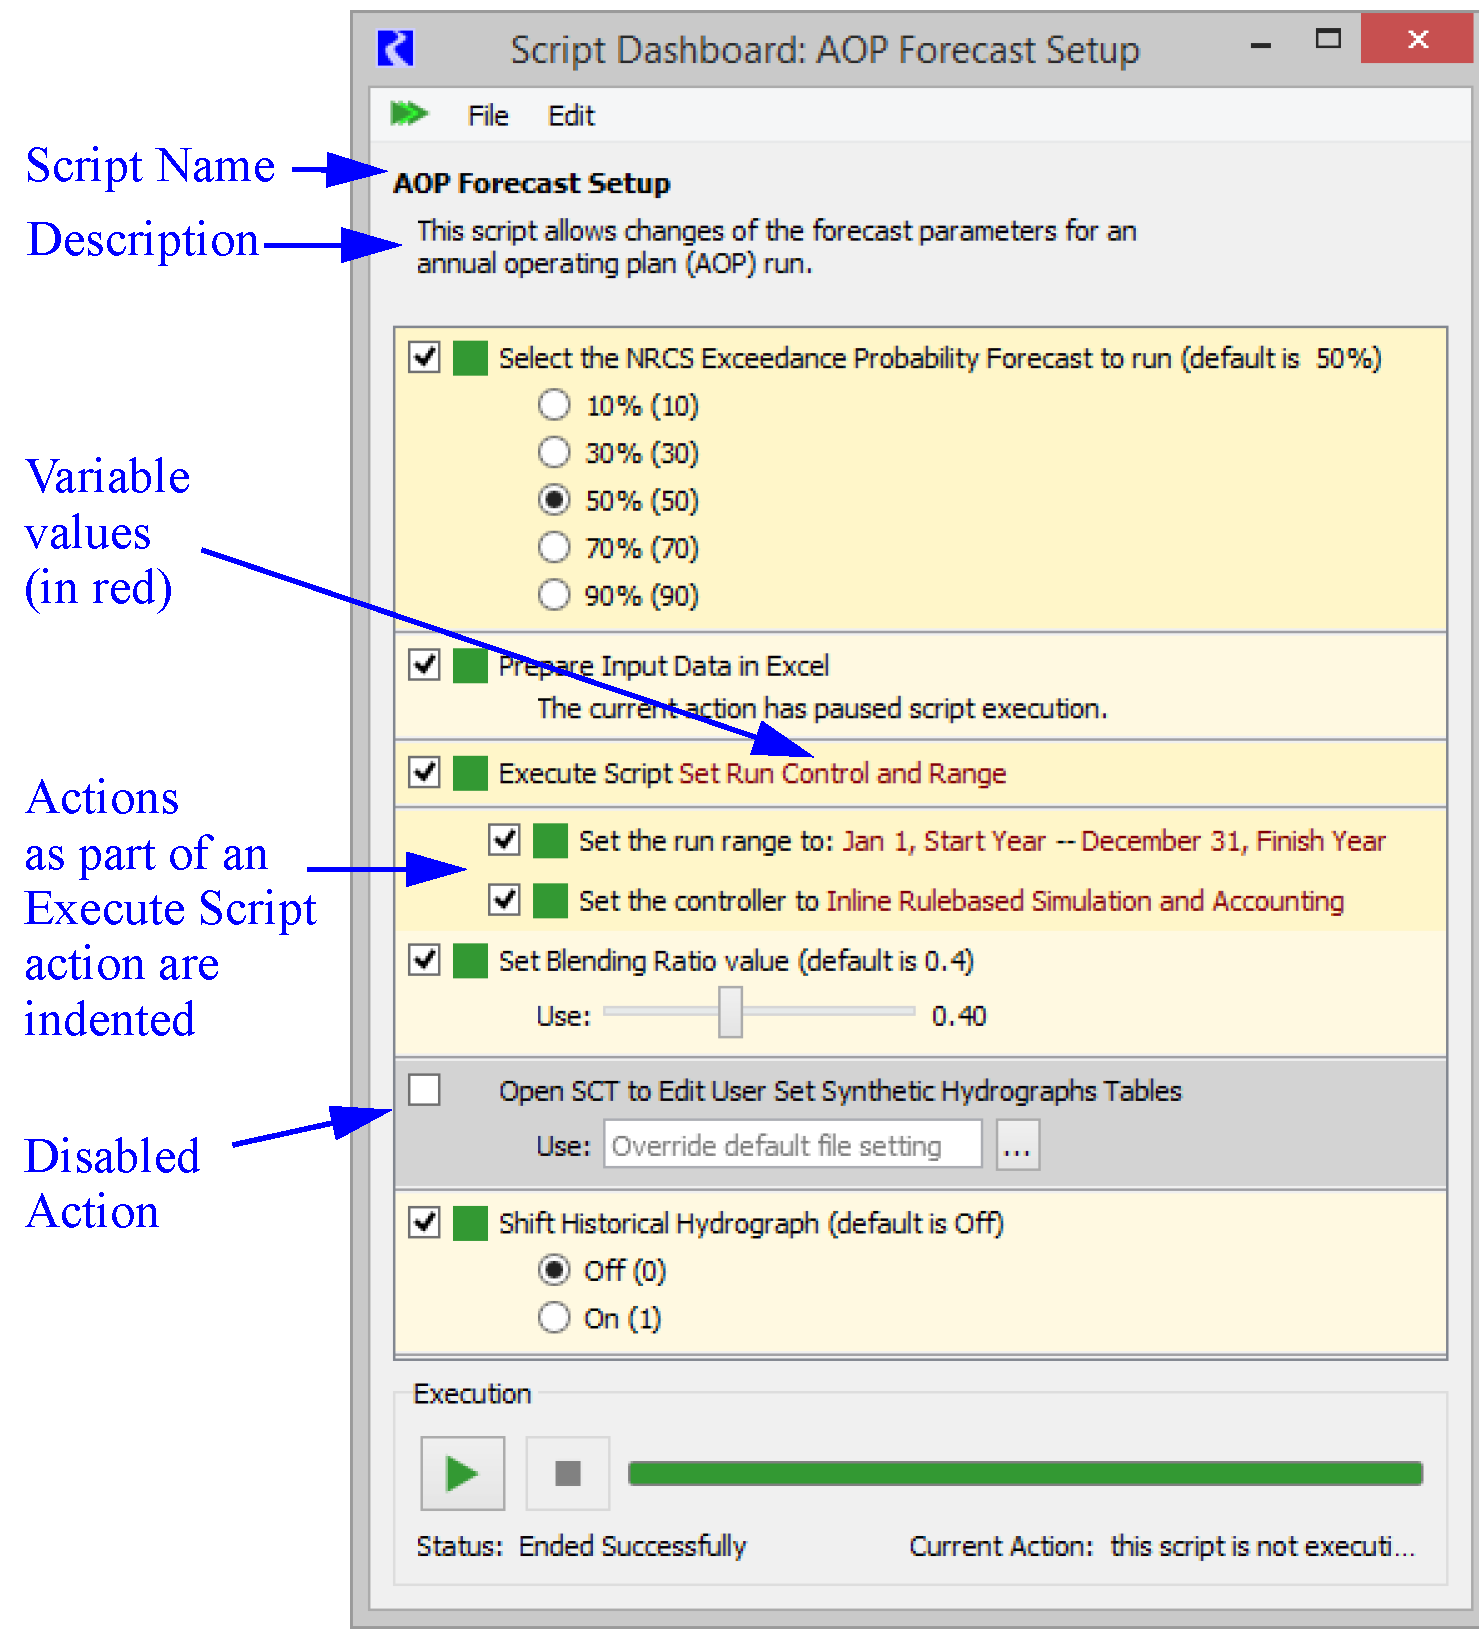
Figure 1.21 identifies additional features of this dialog.
• The script name and description are shown at the top.
• The script variable values are shown in red. Editable values are shown as either text edit fields, buttons, or sliders.
• Actions which are part of an Execute Script action (i.e. a subscript) are indented.
• Disable an action by selecting the check box. This turns that row grey. Use Edit, then Enable All Action to enable all actions shown in the dashboard at once; similarly Edit, then Disable All Action disables them all. Use the Edit, then Reset Values option to revert all values in the Script Dashboard back to the default value as defined in the Script Editor.
• To run the entire script, specify any desired override values (where configured) in the Script Dashboard and then select the Run button.

Figure 1.21 Annotated screenshot of the Script Dashboard
Executing Actions From the Script Dashboard
Use the following options to execute the script:
• Use the Start button to run the entire script.
• Use the Execute Action context menus to run a single action.
• Use the Execute Script from this Action context menu to run that action and the remainder of the script.
Figure 1.22 Shows the context menu options.
Figure 1.22 Screenshot of dashboard context menu operations
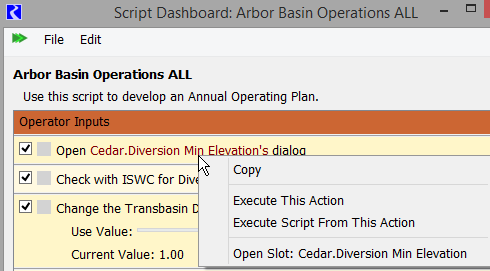
Figure 1.22 shows two additional operations from the context menu on the dashboard:
• Copy: Use this menu to copy the action and its settings and then paste it into a Script Editor.
• Open Slots: For actions that involve slots (Set Series Slot, Open Slots, and so on), you can open those slots directly from the context menu.
Progress and Status on the Dashboard
The Script Dashboard provides a progress bar at the bottom of the dialog showing the current action and the overall progress (based on the number of actions). As script actions execute, the Script Dashboard scrolls to keep the currently executing action in view.
A rotating icon to the right of the Enable/Disable checkbox and darkened frame progress through the script to indicate the currently executing action.

Actions that have completed successfully are indicated by a small green square to the right of the Enable/Disable checkbox.
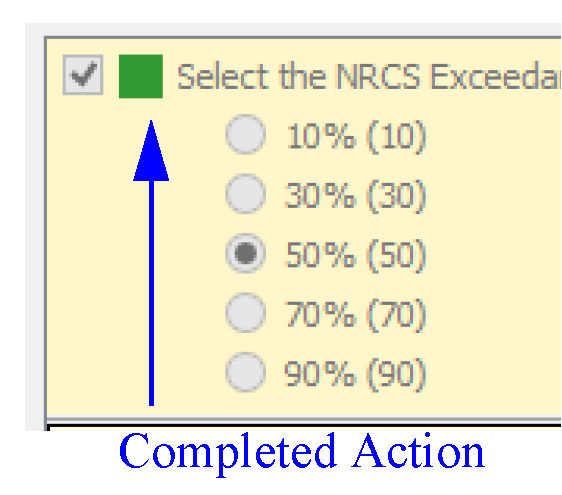
Actions resulting in an error, show a red square indicator.

During script execution, a dark horizontal line between actions indicates a hidden action (one that is not shown in the dashboard as configured in the editor) is executing.
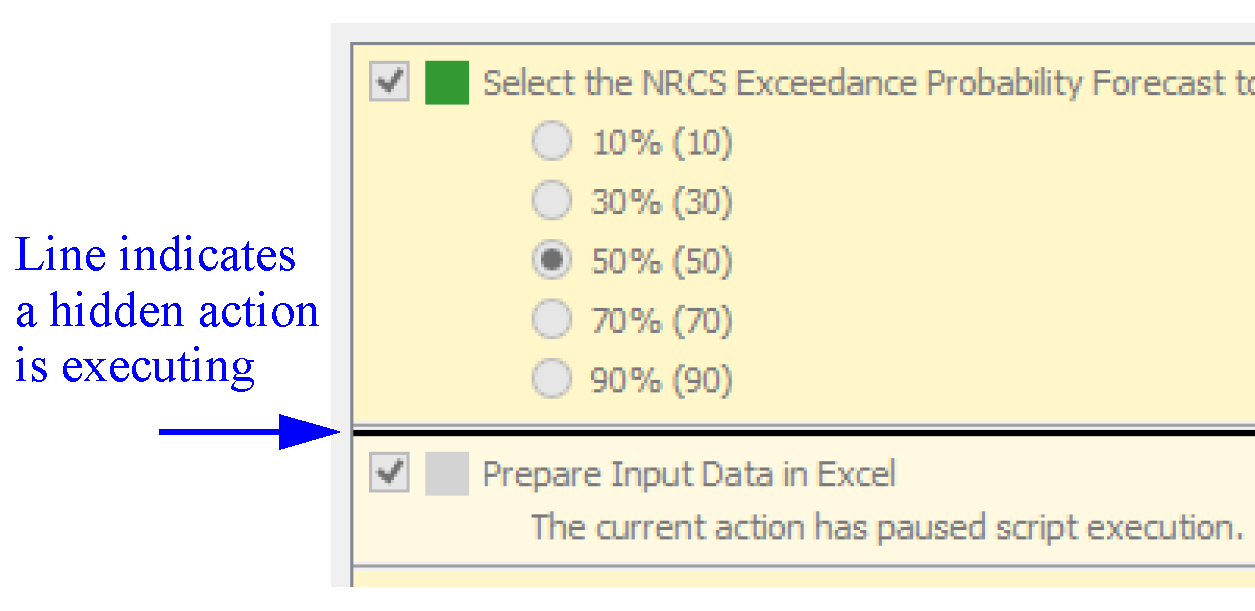
If the script fails or a Memo with confirmation is encountered, a dialog will open alerting you. For the Memo, you must select the Continue button to resume execution.
Note: The script developer can specify which actions are shown on the Script Dashboard. Therefore, the dashboard may not contain all the actions executed by the script.
Revised: 12/01/2020