
Viewing Account Data
The Edit Account dialog is used by all account types, which look similar although there are different slots for each type of account. The Edit Account dialog is the main window used to view an account’s data, as shown in Figure 3.10.
Figure 3.10 Annotated Screenshot of the Edit Account Dialog
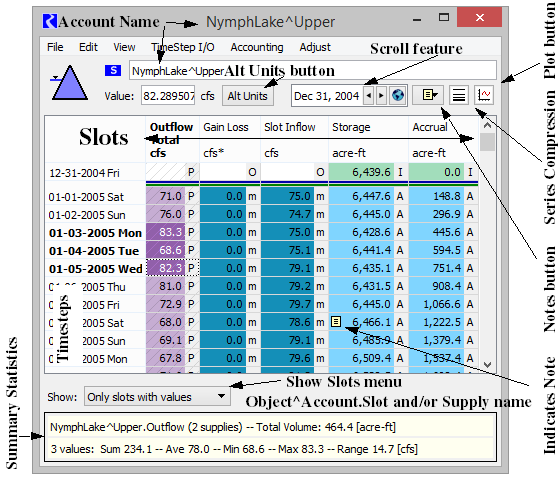
On the top of the dialog, the account name is given in the form Object^Account. There is an icon for the object type on which this account resides. In this case, it is a Storage Reservoir. In addition, there is an icon that shows the type of this account; that is, a storage account.
 On the left side of the dialog are the timesteps for the accounting system. Each column in the table represents a slot that may contain data.
In addition, there is an icon that shows the type of this account; that is, a storage account. On the left side of the dialog are the timesteps for the accounting system. Each column in the table represents a slot that may contain data. The slots displayed in this dialog depends on the type of account; that is, storage, passthrough or diversion. Additionally, the Show menu allows you to specify whether to show All Slots, Only Slots with values (non NaNs) or Only slots with non-zero values.
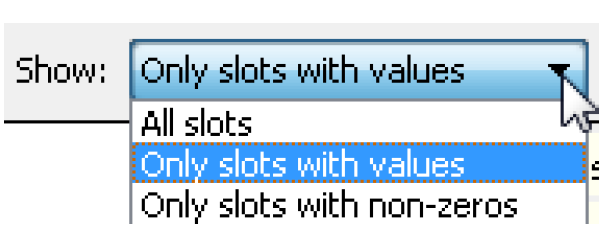
Note: When first constructing a model, it may be necessary to show all slots to allow the user to input initial storages and accruals. Once constructed, it is frequently desirable to not show empty slots as there are a number of slots on the accounts that likely will not be used in every model.
• Specify to Show all Slots. Notice that in addition to Outflow, Gain Loss, Slot Inflow, Storage and Accrual, there are now empty columns for Inflow, Diversion, Return Flow, Maximum Accrual, Transfer In, Transfer Out, Begin Year Allocation, and Carry Over.
Above the timesteps, there is an Alt Units toggle button that switches between Flow units and Volume units
Figure 3.11 Edit Account dialog with Alt Units menu button shown
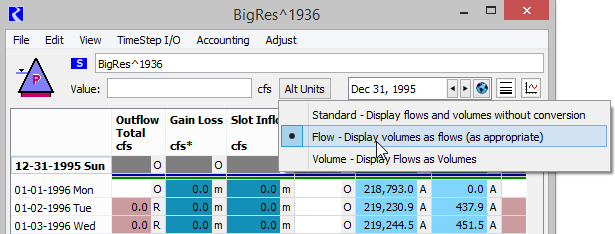
As shown in Figure 3.11, the button opens a menu that switches the display between
– Standard - Display flows and volumes without conversion
– Flow - Display flow slots as flows and display volumes as flows (as appropriate) - This is the default.
– Volume - Display flow slots as Volumes and display volume slots as volumes.
Select Flow to see the flow values as a volume. Notice that the values have changed and the columns now say acre-feet instead of cfs. The value shown is the volume over the timestep. Slots on accounts use the active Unit Scheme for display and input; see Unit Schemes in User Interface for details. As with the physical system, the accounting system maintains its values in internal units, regardless of the units chosen for display.
Note: Slots shown in their alternate unit type display an asterisk next to the unit. For example, Gain Loss, when shown as a flow, displays Gain Loss cfs*.
Tip: All flow slots can be shown as the volume over the timestep, but the reverse is not true. Only a handful of volume slots, like Gain Loss, can be shown as a flow. Storage and Accrual do not respond to the toggle; they always are shown as volumes.
Accounting dialogs use colors to represent the process used to set the accounting values. A key is provided that shows the meaning of each color.
• From the menu bar, select View, then Show Account Color Legend to bring up a window showing the Grid Cell Legend. The second column of colors is the color when the cell is selected.
Figure 3.12 Accounting color legend
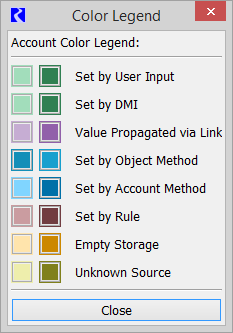
In addition, there is a letter flag on each value that corresponds to each color. Use the key to determine the meaning of each letter. In addition, slots that are Read-Only are shown with a cross-hatch.
Note: The Empty Storage Flag denoted with the letter “E” and the orange background can be used on outflow supplies from Storage accounts to compute the flow that leads to zero storage. See Using the Empty Storage Flag for details.
In a Rulebased Simulation run, the Edit Account dialog also can show the priority of the slot at the given timestep. This can enable/disabled using the View, then Show Priorities menu
The edit account dialogs show tooltips indicating which rule or DMI was responsible for the specified value, where applicable. See Tooltips in User Interface for additional information.
Back on the Edit Account dialog, a scroll button and DateTime spinner allows the user to jump to a specified date. Either type in a valid date in the date box and select the Scroll button to move to that date. Or, use the up and down arrows to advance to the desired timestep.
Tip: Undo and redo are available for editing values in these accounting dialog boxes. See Undo and Redo in User Interface for more information.
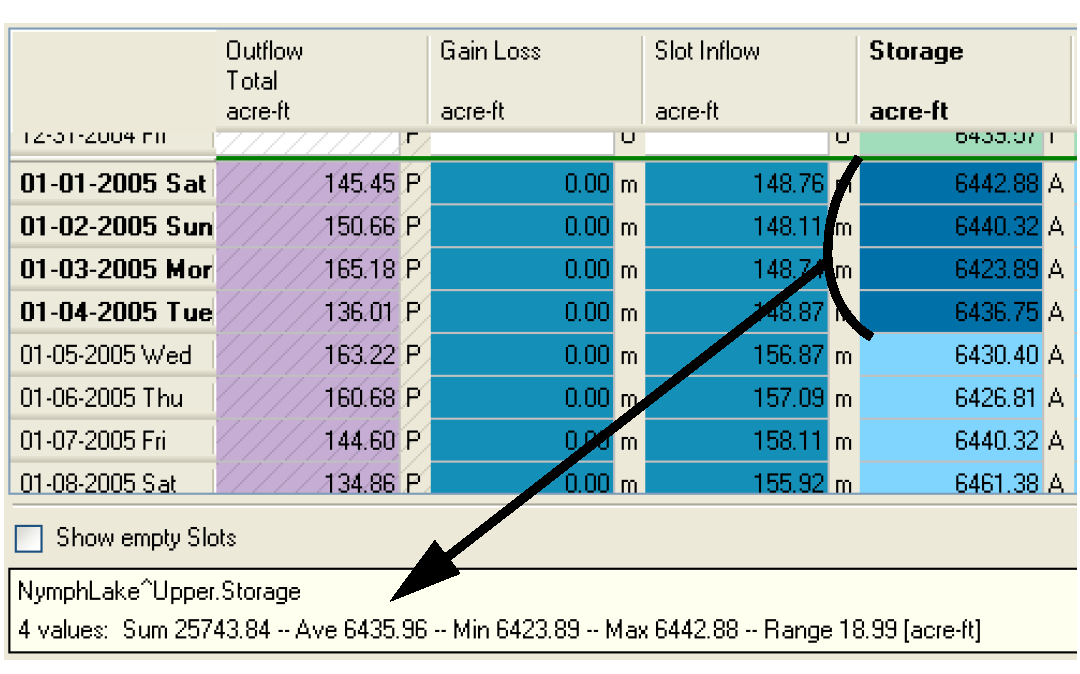
When the user selects a range of cells in the Edit Account dialog, the dialog displays information about the name and summary information of that selection in the bottom of the window. If the selection is just in one slot, it displays the name of the slot or that the slots consists of one or more supplies. If the selection spans multiple slots, then the name displays how many slots are selected. In addition, summary data at the bottom of the dialog shows the sum, average, minimum, maximum, and range of the selection.
At the bottom of the dialog, the summary information says that the average is 6435.96 acre-ft, as shown in Figure 3.13. It also displays that the NymphLake^Upper.Storage account is selected.
Figure 3.13
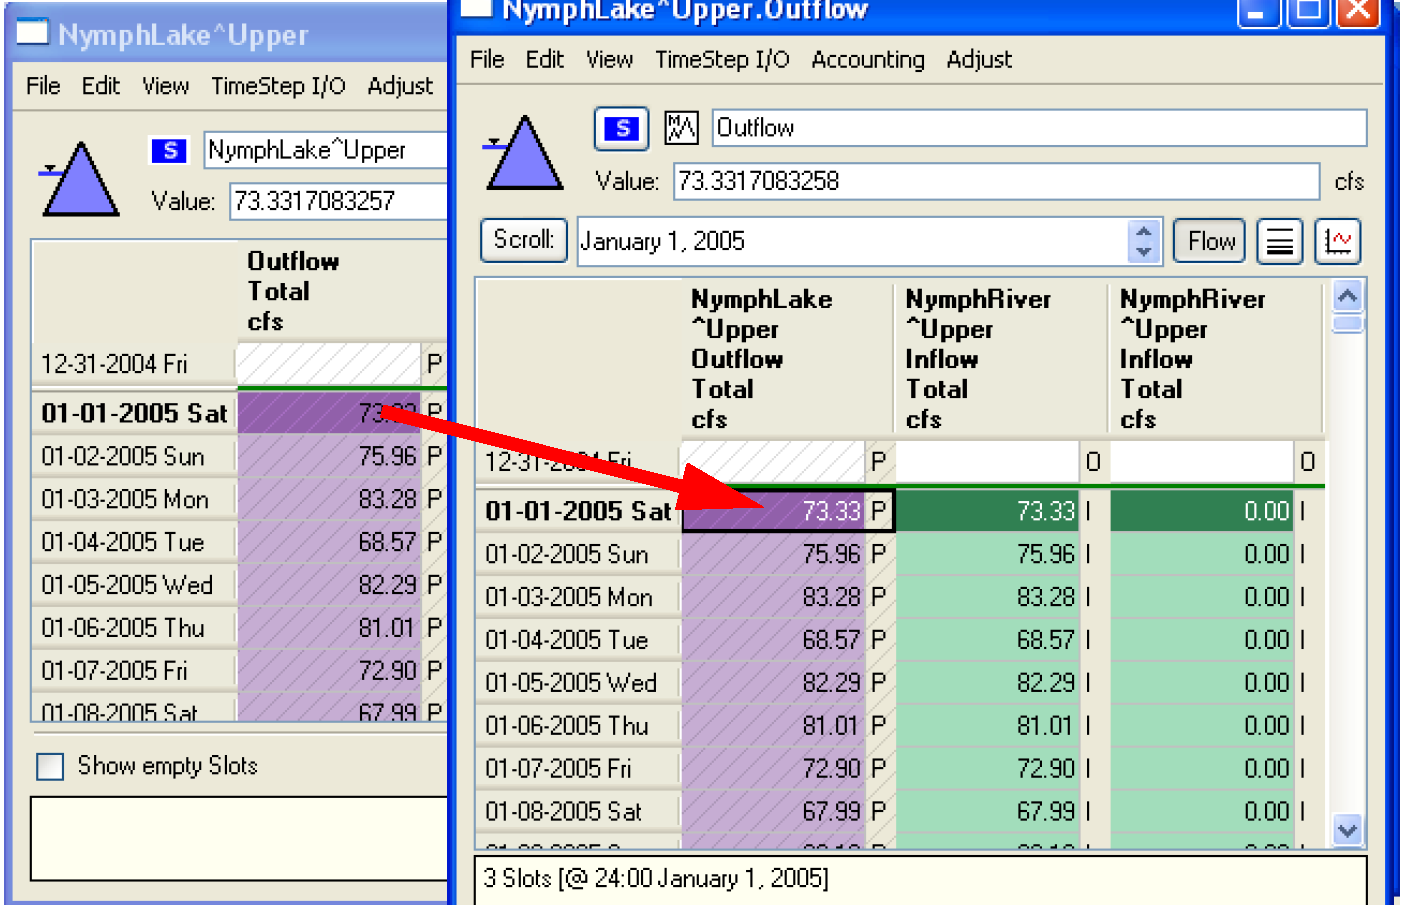
Outflow, Inflow, Transfers, Diversion, and Return Flow slots on the Edit Account dialog can actually consist of more than one value if the user has configured to have multiple supplies coming into or out of that slot. We will discuss this in detail later. For now, let us just be aware that a column can represent more than one time series of data. If a column in the Edit Account dialog does in fact have multiple components, the column in the Edit Account dialog will be cross hatched meaning it is read-only. Double-clicking the column opens a new windows showing the multi-slot which consists of the total sum and the component supplies.
A new window opens showing the multislot, as shown in Figure 3.14. On the left is the Edit Account dialog. On the right is the multi-slot that results when the user double-clicks on the Outflow slot.
Note: The numbers in the first column of both dialogs are the same and the second dialog shows the components of the total.
Figure 3.14
There is also the ability to hide or compress repeated values, a specified value, or NaNs. See Series Display Compression in User Interface for additional information about Series Display Compression.
Note: When using the Edit Account dialog, the user can export a selection of cells using the Export Copy functionality. This allows the user to export data to the clipboard and then paste it into other applications like Excel.
Revised: 08/02/2021