
Optimization Power
The Optimization Power category allows the user to select which type of linearizations will be used for linearizing various slots. For Independent Linearizations all slots are linearized separately according to the user-specified methods. This category has no dependencies.
This is the default method. No slots are added for this method.
Note: It is an error to have this method selected for Optimization.
The Independent Linearizations method linearizes all the variables separately according to the user-selected methods. The variables that need to be linearized vary greatly depending on the other methods selected.
See the various Categories and Linearization Approaches for details.
Slots Specific to This Method
Power LP Param
Type: Table Slot
Units: Length and Flow
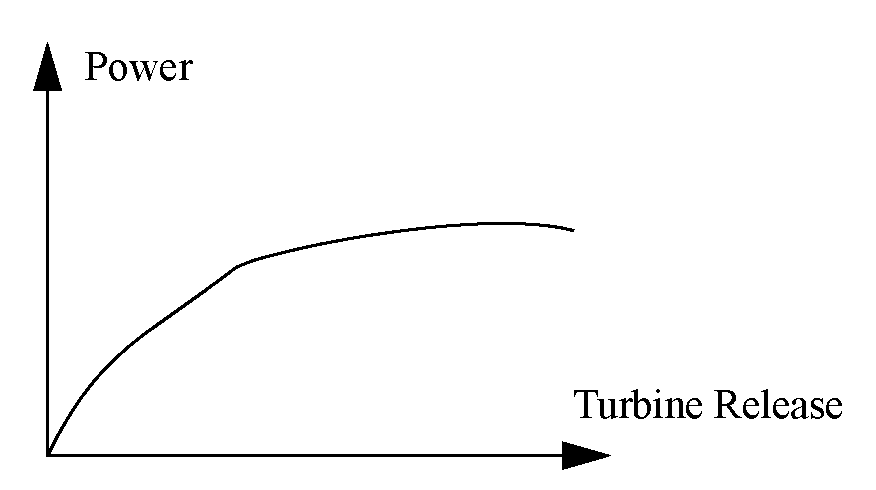
Description: Specifies the Operating Head and the flow points used to take the tangent, line and piecewise approximations for Power linearization
Information: This table must be user input when the Independent Linearizations method is selected. The best Operating Head to choose should be close to the expected head during optimized period. Tangent approximation is generally not used, nor helpful as it often results in non-zero power for zero flow. The suggested points for a line approximation are 0 flow and best turbine flow for the entire plant. The suggested points for piecewise linearization are 0 flow, 1 unit best turbine flow, 2 units best turbine flow ... n units best turbine flow, and maximum turbine flow.
Defined by: Input
Power turbine release relationship for a fixed operating head valve. Not drawn to scale.
Method Details
If the Optimization problem uses Power, either directly or indirectly, the Power slot is added to the problem.
Before being passed to the optimization solver, the Power slot is numerically approximated as a function of Operating Head and Turbine Release (Numerical 3-D Approximation).
The relationship between Operating Head and Turbine Release comes from the Plant Power Table. This table must be user input. The table is queried using the points defined in the Power LP Param table.
The Power Coefficient method models Power at each time step as follows:

Slots Specific to This Method
Power Coefficient Estimate
Type: Series Slot
Units: PowerPerFlow
Description: This represents the estimated Power Coefficient that gets used in the Optimization definition of Power.
Information: The Power Coefficient Estimate is a required input for the run. It can either be input directly (manually or by DMI), or it could be set by an initialization rule. For example, an initialization rule could set the Power Coefficient Estimate based on a Seed (Slot Cache) value. If the Power Coefficient method is selected, and Power Coefficient Estimate is not an input for all time steps, then the run terminates with an error message.
Defined by: Input
This method allows for the modeling of dynamic Operating Head to be incorporated into Optimization Power modeling. It provides a significant improvement in the Power approximation error over the linearization using the Power LP Param table, which assumes a constant Operating Head over the entire run period. The improvement is especially significant for projects that exhibit a wide range of Operating Head over the course of the run, particularly if the optimization policy is trying to maximize Power or set Power greater than or equal to a value.
The method introduces a new variable, PSA Head Factor, which represents the weighted contributions of Storage, Spill and Tailwater Base Value to Operating Head. The method generates a set of planes, the Power Surface, to constrain power as a function of Turbine Release and the PSA Head Factor.
The Power Surface can be thought of as pavement over a warped bridge that is level on one end and sloped and higher on the other end. The bridge ends represent zero Turbine Release and maximum Turbine Release respectively. In addition, the bridge is bowed concave across the center line everywhere except the level (zero Turbine Release) end. This bowing reflects Power as a function of the Head Factor for a fixed value of Turbine Release. The edges of the bridge represent Power as a function of Turbine Release for the low and high values of the Head Factor. Additional points defining a grid on the surface correspond to intermediate values of Turbine Release and the Head Factor. The user can define dimensions and points used for this grid. A piecewise linear surface is composed of cutting planes with each plane defining one triangle on the surface. A surface underneath the bridge composed of two planes defines a lower bound on Power given Turbine Release and Head Factor values.
Because only two planes can be defined for the lower bounds on power, additional approximation error can be introduced if the optimization policy has an incentive to minimize power. In these cases the optimization solution can have an incentive to under-approximate Power for a given Turbine Release, and thus the Post-optimization Rulebased Simulation will calculate a larger Power value than the optimization value for Power.
Slots Specific to This Method
PSA Sample Input
Type: Table Slot
Units: Flow, Volume, Flow, Length
Description: This table contains user-specified sample values for Turbine Release, Storage, Total Spill (if applicable) and Tailwater Base Value (if applicable) that are used by RiverWare to compute the PSA Head Factor Weights. The four parameters in this table represent all of the parameters that contribute to Operating Head. In other words, if a value is known for each of these parameters, it is possible to calculate the corresponding Operating Head.
Information: The values in this table should span the full possible range for each parameter for the given run. For example, the Turbine Release column should contain a value of 0, the highest possible turbine release from the reservoir, and any other intermediate values specified by the user. Specifying tighter upper and lower bounds for each parameter will improve the approximation, but it is important that all possible values for each variable within the run are spanned by the range for that parameter in the table. The user can determine how many rows to include in the table. It is expected that typically, three to four values are specified for each parameter. An example is shown below. The Spill column should only contain values if a method other than None has been selected in the Spill category. Otherwise the Spill column should be left empty (displays “NaN”). The Tailwater Base Value column should only contain values if the reservoir’s Tailwater Base Value slot is linked to the Pool Elevation slot of a downstream reservoir (that is, if the Downstream Reservoir Pool Elevation contributes to the calculation of Operating Head). Otherwise the Tailwater Base Value column should be left empty.
Defined by: User input
Turbine Release | Storage | Spill (Total) | Tailwater Base Value |
|---|---|---|---|
0 | 0 | 0 | 500 |
100 | 1000 | 50 | 510 |
200 | 2000 | 100 | 520 |
PSA Head Factor Grid Lines
Type: Scalar Slot
Units: None
Description: The number of PSA Head Factor values for each Turbine Release value used when calculating the PSA Grid Points
Information: This must be an integer greater than or equal to 2. The value should typically range from 2 to 4. A larger number will improve the approximation but will increase run time.
Defined by: User input
PSA Turbine Release Grid Lines
Type: Scalar Slot
Units: None
Description: The number of Turbine Release values for each PSA Head Factor value used when calculating the PSA Grid Points
Information: This must be an integer greater than or equal to 2. The value should typically range from 2 to 4. A larger number will improve the approximation but will increase run time.
Defined by: User input
PSA Sample Output
Type: Table Slot
Units: Flow, Volume, Flow, Volume, Power
Description: A table containing all permutations of the values entered in the PSA Sample Input table slot along with the Power calculated for each combination of Sample Input values. This sample output is used to calculate the PSA Head Factor Weights.
Information: RiverWare will populate this table at the beginning of the run. For the PSA Sample Input table shown above, with three values in each of the four columns, this table would contain 81 rows, one for each permutation. For a given combination of Turbine Release, Storage, Spill and Tailwater Base Value, RiverWare can calculate the corresponding Power. The third column will contain the Downstream Storage values corresponding to the Tailwater Base Value entries in the PSA Sample Input slot.
Defined by: Populated by RiverWare at the beginning of the run.
For each row i in the table:

The calculation of SamplePower depends on the selected Power and Tailwater methods.
PSA Head Factor Weights
Type: Table Slot
Units: PerTime, None, PerTime
Description: The weights for Storage, Spill and Downstream Storage used when calculating PSA Head Factor
Information: This is a 1 x 3 table with a single weight for Storage, Spill and Downstream Storage. The weights are calculated by RiverWare by performing a regression on the values in the PSA Sample Outputs table slot. If one of the parameters is not used (contains NaN for all rows in the PSA Sample Input table), the corresponding weight in this table slot will be zero.
Defined by: Calculated by regression at the beginning of the run
PSA Head Factor
Type: Series Slot
Units: Flow
Description: This slot is a variable in the optimization solution and represents the weighted contribution of Storage, Spill and Downstream Storage to Operating Head and thus power. It can be thought of as a storage analog of Operating Head.
Information: This variable is used in the automatically generated constraints that define Power. It will not, generally display any values, but the user can write a post-optimization rule that calculates the value of this variable at each time step using the equation shown below and the values in the PSA Head Factor Weights table slot.
Defined by: 
The coefficients  come from the PSA Head Factor Weights table slot.
come from the PSA Head Factor Weights table slot. PSA Grid Points
Type: Table Slot
Units: Flow, Volume, Flow, Volume, Power, Flow
Description: Points used to calculate the planes for the PSA Max Constraints and PSA Min Constraints, one row for each point with columns for Turbine Release, Storage, Spill, Downstream Storage, Power and PSA Head Factor.
Turbine Release Column—Smallest and largest values from PSA Sample Input and evenly spaced intermediate values corresponding to the number of lines in the PSA Turbine Release Grid Lines scalar slot.
Storage, Spill and Downstream Storage Columns—Smallest and largest values from PSA Sample Input and evenly spaced intermediate values corresponding to the number of lines in the PSA Head Factor Grid Lines scalar slot.
Power Column—Determined by selected Power method, for each row i in the table.

Head Factor Column—The coefficients  come from the PSA Head Factor Weights table slot.
come from the PSA Head Factor Weights table slot. 
Information: The number of rows (points) in this table equals the product of the number of lines in the PSA Head Factor Grid Lines and PSA Turbine Release Grid Lines scalar slots. For each grid point, RiverWare calculates the value of Power and the PSA Head Factor corresponding to the parameter values in that row.
Defined by: Populated by RiverWare at the beginning of the run
PSA Max Constraints
Type: Table Slot
Units: Flow, Flow, Flow, Flow, Flow, FLOW, PowerPerFlow, PowerPerFlow, Power
Description: This table contains the planes that define the upper bounds for power as a function of Turbine Release and PSA Head Factor, one row for each plane. Power is constrained to be less than or equal to the planes defined in this table. The first six columns contain three pairs of Turbine Release and PSA Head Factor values that define three points on the plane. The remaining three columns contain the corresponding Turbine Release Coefficient, Head Factor Coefficient and Constant Term that define the same plane and are used in the actual constraint expressions.
Information: The points used to define the planes come from the Turbine Release and Head Factor points in the PSA Grid Points table slot. RiverWare will not use all of the possible combinations of Turbine Release and Head Factor points but rather will only use the combinations necessary to define the Power Surface.
Defined by: Populated by RiverWare at the beginning of the run
For each row i in the PSA Max Constraints table slot, a constraint is added to the optimization problem, as follows:

The coefficients ui, vi and wi are the Turbine Release Coefficient, Head Factor Coefficient and Constant Term from row i of the PSA Max Constraints table. Turbine Release and PSA Head Factor are the actual variables in the optimization problem.
PSA Min Constraints
Type: Table Slot
Units: Flow, Flow, Flow, Flow, Flow, FLOW, PowerPerFlow, PowerPerFlow, Power
Description: This table contains the planes that define the lower bounds for power as a function of Turbine Release and PSA Head Factor, one row for each plane. Power is constrained to be greater than or equal to the planes defined in this table. The first six columns contain three pairs of Turbine Release and PSA Head Factor values that define three points on the plane. The remaining three columns contain the corresponding Turbine Release Coefficient, Head Factor Coefficient and Constant Term that define the same plane and are used in the actual constraint expressions
Information: This table will always contain two rows. Only two planes can be defined for the lower bounds on power.
Defined by: Populated by RiverWare at the beginning of the run.
For each row i in the PSA Min Constraints table slot, a constraint is added to the optimization problem, as follows:

where the coefficients ui, vi and wi are the Turbine Release Coefficient, Head Factor Coefficient, and Constant Term from row i of the PSA Min Constraints table. Turbine Release and PSA Head Factor are the actual variables in the optimization problem.
Method Details
The following slots require input from the user:
RiverWare carries out the following steps to populate the remaining table slots associated with this method.
1. Populate the PSA Sample Output Table with all permutations of parameters in the PSA Sample Input table slot.
2. Calculate the PSA Head Factor Weights using a regression based on values in the PSA Sample Output table slot.
3. Add defining constraints for PSA Head Factor using the PSA Head Factor Weights.
4. Populate the PSA Grid Points table slot based on the number of grid lines specified by the user.
5. Generate upper bound planes using the PSA Grid Points and add the corresponding constraints on Power to the Optimization problem.
6. Generate lower bound planes using the PSA Grid Points and add the corresponding constraints on Power to the Optimization problem.
Power Surface Definition Details
This section provides details of the calculations carried out by RiverWare to generate the constraints that define the Power Surface. This material is included for reference only.
1. RiverWare populates the PSA Sample Output table slot. All permutations of values in the PSA Sample Input table slot are determined, and a row for each is added to the PSA Sample Output table slot. RiverWare may make some adjustments to prevent infeasible combinations. For example, the highest Turbine Release value may not be possible for all combinations of Storage, Spill and Tailwater Base Value. RiverWare will adjust the Turbine Release to use the maximum turbine release for the resulting Operating Head. The table is organized in blocks of constant Turbine Release, with the lowest Turbine Release block first and then increasing Turbine Release. The values in the remaining columns are ordered corresponding to increasing Operating Head. Storage is increasing. Spill and Tailwater Base Value (or Downstream Storage) are decreasing. For each combination of values (each row), RiverWare calculates the corresponding Operating Head and Power. The Power value is added to each row in the PSA Sample Output table. The details of these calculations are shown here for a given row i in the PSA Sample Output table.
Note: Poweri is the only calculated quantity displayed in the table. Values from the intermediate calculations shown below are not displayed in the table.

Pool Elevation is calculated by interpolation on the reservoir Elevation Volume Table.
If Tailwater Base Value is linked to Pool Elevation of a downstream reservoir, as follows:

Tailwater Base Value is calculated by interpolation on the downstream reservoir Elevation Volume Table. Tailwater Base Value is only calculated from the Downstream Storage if either Base Value Plus Lookup Table, Stage Flow Lookup Table or Coefficients Table is the selected Tailwater method and Tailwater Base Value is linked to the Pool Elevation of the downstream reservoir. Otherwise Tailwater Base Value is unused, and thus Operating Head and Power are not dependent on Downstream Storage.

Spill will only be non-zero if a method other than None is selected in the Spill category.

The tailwater calculation is dependent on the selected method in the Tailwater category.


The Power calculation is dependent on the selected method in the Power category.
2. RiverWare calculates the PSA Head Factor Weights using a combination of linear regression and averages.
FOR EACH Turbine Release value i
FOR EACH combination of Spill and Tailwater Base Value (or Downstream Storage), k, perform a linear regression to calculate a temporary Storage coefficient gik:

where n is the number of Storage values.
Calculate the temporary Storage coefficient for the given Turbine Release, gi:

where n is the number of Spill and Downstream Storage) combinations.
FOR EACH combination of Storage and Downstream Storage, k, perform a linear regression to calculate a temporary Spill coefficient eik:

where n is the number of Spill values.
Calculate the temporary Spill coefficient for the given Turbine Release, ei:

where n is the number of Storage and Downstream Storage combinations.
FOR EACH combination of Storage and Spill, k, perform a linear regression to calculate a temporary Downstream Storage coefficient fik:

where n is the number of Downstream Storage values.
Calculate the temporary Downstream Storage coefficient for the given Turbine Release, fi:

where n is the number of Storage and Spill combinations.
Calculate average ratios over all Turbine Release values:


where n is the number of Turbine Release values.
Calculate the final Head Factor Weights:


If Tailwater Base Value is linked to the downstream Pool Elevation:

These three weight values are displayed in the three columns of the PSA Head Factor Weights table slot.
In the optimization solution the PSA Head Factor is defined at a given time step by
If Tailwater Base Value is linked to the downstream Pool Elevation:

If Tailwater Base Value is not linked:

3. RiverWare calculates the grid points for the PSA Grid Points table slot. The number of rows (points) in this table equals the product of the number of lines in the PSA Head Factor Grid Lines and PSA Turbine Release Grid Lines scalar slots. The smallest and largest values in the PSA Sample Input slot lead to the smallest and largest values for each of the parameters that affect power (Turbine Release, Storage, Spill and Downstream Storage. One row in this table will correspond to the smallest Turbine Release, smallest Storage, largest Spill and largest Downstream Storage, and thus smallest power. Another row will correspond to the largest Turbine Release, largest Storage, smallest Spill and smallest Downstream Storage, and thus the largest Power. RiverWare generates evenly spaced values between the extremes for each variable.Within the PSA Grid Points table, for a given Turbine Release value, Storage is increasing and Spill and Downstream Storage are decreasing. For each grid point, RiverWare calculates the value of Power and the PSA Head Factor corresponding to the parameter values in each row and adds these to the final two columns in the table.
For each row i in the table:

The Power calculation depends on the method selected in the Power category.

The coefficients  come from the PSA Head Factor Weights table slot.
come from the PSA Head Factor Weights table slot.4. RiverWare calculates the upper bound planes. These are entered in the PSA Max Constraints table slot, one row for each plane, where the planes represent Power as a function of Turbine Release and PSA Head Factor. For each combination of three points in the PSA Grid Points Table, RiverWare calculates the corresponding plane. For any three points, the plane is defined by three linear equations, which can be represented in matrix form.


The coefficients that define the plane are solved for by

RiverWare only uses the planes that are necessary to define the Power Surface. Each plane is checked against all remaining points in the PSA Grid Points table. If the Power value for any of the remaining points lies above the given plane, then that plane is rejected (that is, it would over-constrain Power, resulting in an under-estimation of Power). For each plane i that is used, RiverWare adds the following constraint to the optimization problem for each time step:

5. RiverWare calculates the lower bound planes. These are entered in the PSA Min Constraints table slot, one row for each plane. Only two planes can be calculated for the lower bounds. The points used for the two planes are as follows:
Plane 1:
– Point A1 - Min Turbine Release, Max Head Factor
– Point B1 - Max Turbine Release, Max Head Factor
– Point C1 - Min Turbine Release, Min Head Factor
Plane 2:
– Point A2 - Min Turbine Release, Max Head Factor
– Point B2 - Max Turbine Release, Max Head Factor
– Point C2 - Max Turbine Release, Max Head Factor
The coefficients defining the planes are calculated using the same matrix calculation described for the upper bound planes. For each lower bound plane i, RiverWare adds the following constraint to the optimization problem for each time step:

Note: Regarding the lower bound approximation, because only two planes can be defined for the lower bounds on power, additional approximation error can be introduced if the optimization policy has an incentive to minimize power. This can occur if Power is included in a Minimize objective. It can also occur if the optimization problem contains constraints that require Power to be less than or equal to value.
Note: These types of constraints can be introduced through multiple forms of RPL optimization goals. The first is basic less than or equal to constraint.
ADD CONSTRAINT 
Policy that requires Power to be equal to a value also adds a less than or equal to constraint. The following RPL statement:
ADD CONSTRAINT 
actually adds the following two constraints to the optimization problem:


A constraint to require the sum of Power from multiple reservoirs to be less than or equal to a value will have a similar effect. A final manner in which this can occur is through policy that minimizes Power indirectly through user-defined variables. For example, assume a user-defined variable is defined by the following RPL constraint:
ADD CONSTRAINT 
Then later the variable is constrained by the following:
ADD CONSTRAINT 
An equivalent constraint would be as follows:
ADD CONSTRAINT 
It is possible to reduce the approximation error in these cases by adding constraints to the RPL Optimization Goal Set that essentially create more restrictive planes for the lower bound. These types of constraints are model-specific. Contact CADSWES if assistance is required to add more restrictive lower bounds to the Power Surface Approximation.
Revised: 08/02/2021