
Output Devices
Plotting
Legends
Plot Legends were improved as follows:
• Markers can now be shown in the legend on a per-marker basis.
• Both curves and marker legend items can be removed from the legend. Configuration controls are available in the individual configuration dialogs, the Configure Multiple Plots and Curves and from the right-click context menu.
Figure 6.2
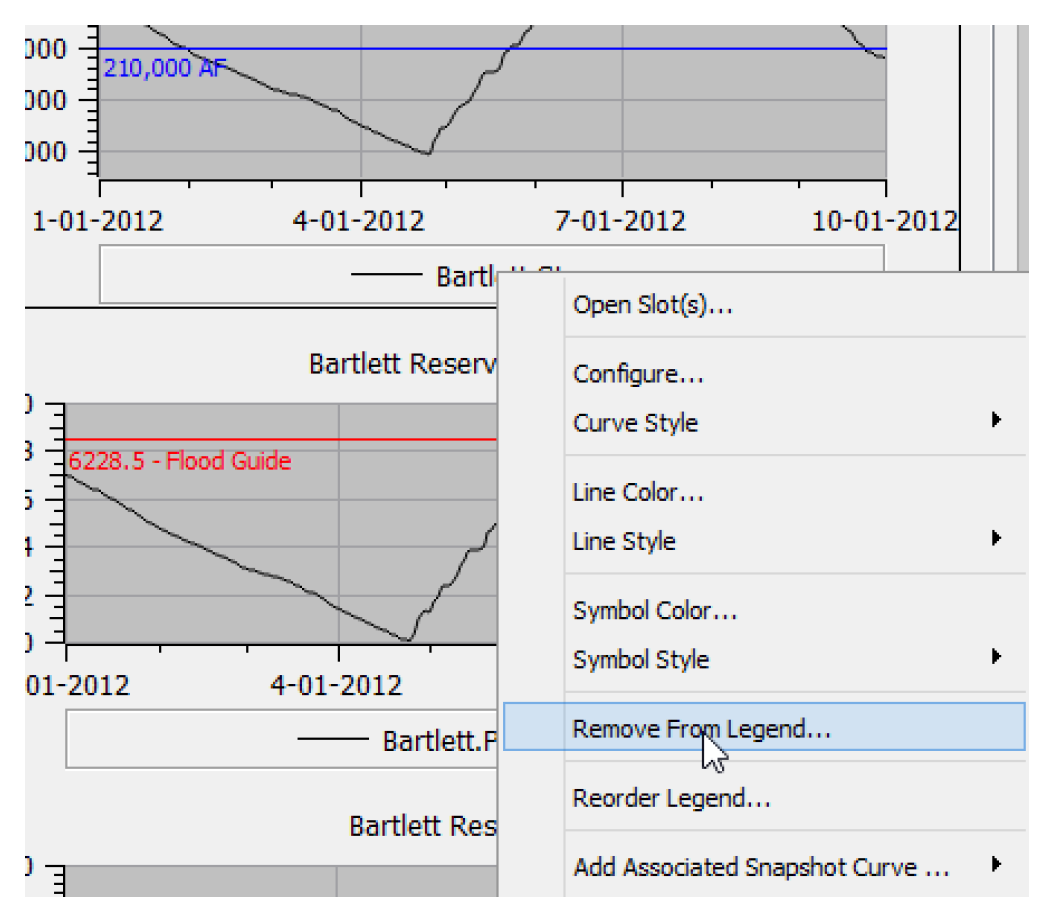
Adding Snapshot Curves
Snapshots are way to preserve results between runs; see Snapshots in Output Utilities and Data Visualization for details. For comparison, it is useful to plot both the slot and one or more of its snapshots. The plotting utility now allows you to quickly add curves for the associated snapshots. Under the Add Curve button, Plot menu, and right-click context menu on the legend item, there is now an Add Associated Snapshot Curve option (see Figure 6.2).
See Adding Associated Snapshot Curves in Output Utilities and Data Visualization for more information.
Defaults and Settings Dialogs
The plot Preferences dialog was split into two separate dialogs for clarity:
• The Plot Page Settings dialog applies settings to old and new plots; see Plot Page Settings in Output Utilities and Data Visualization for details.
• The Plot Defaults for general defaults applies to new plots only; see Configuration Defaults in Output Utilities and Data Visualization for details.
Better Defaults
Plotting now provides better defaults: a white background, thin dotted gray major grid lines, no minor grid lines, and system fonts. Also, the RiverWare plot default settings can be easily restored. A Restore RiverWare Default button was added to the Plot Defaults dialog and Plot Page Settings dialog.
Copy Plot as Image
You can now copy a plot as an image to the Windows system clipboard for pasting into other applications. This allows a plot or a plot page to be copied and then immediately pasted into an external document without exporting it to a file.
See Copy Plot as an Image in Output Utilities and Data Visualization for more information.
Revised: 08/02/2021