
Output Devices for Aggregated Values
All output devices support outputs at the model timestep size. But sometimes, you want or need to output data at a different timestep size. For example, if you are running an operations model with a 1 Hour timestep, perhaps you would like to output daily totals in a model report. Certain output devices can optionally summarize data; for example, Tabular Series Slot Reports will show you specified statistics (Min, Mean, Max) at fixed intervals (E.g. every 24th timestep) or at 1 Month intervals. These values are shown in addition to the single interval values. But, time series of aggregated information is not directly available from any of the devices. The general approach used in RiverWare is that you must create slots that represent the aggregated values. This section provides some guidance and approach for creating aggregated slots and then showing them in output device.
A general approach for showing aggregated values is to create slots that represent the aggregated values and then include them in your report. There are two types of slots that can be used, as follows:
• Time Aggregation Series Slots. Create a Time Aggregation Series Slot. This slot references a smaller timestep series slot in your model and aggregates (Sum, Avg, Min, Max, Last, First) the values to a larger timestep (1 Day, 1 Month, 1 Year). See Time Aggregation Series Slots in User Interface.
• Series Slots with Expression. Create an expression slot and develop a RPL expression that performs the aggregation. There are many RPL predefined functions and operators that can be used in the expression, such as SumSlot function, SumFlowsToVolume function, SUM operator, and the AVE operator. See Series Slots With Expression in User Interface.
It is usually easier and quicker to configure Time Aggregation Series Slots. But Expression Slots provide flexibility and customization if the aggregation function or time range that you wish to use is different than the provided functions.
Often, for output devices, you wish to show the same aggregated slots for many different objects. Let’s assume we wish to show the average monthly flow (in a model with a timestep of 1 Day) for six different reservoirs. In this example, we will show Time Aggregation Series slots. There are two main approaches to organize the aggregated slots for this calculation as shown in Table 1.1. Also shown are advantages and disadvantages for both.
A. One data object that contains one aggregation slot per reservoir. | B. Create custom aggregation slots on accompanying data objects or directly on the simulation object. |
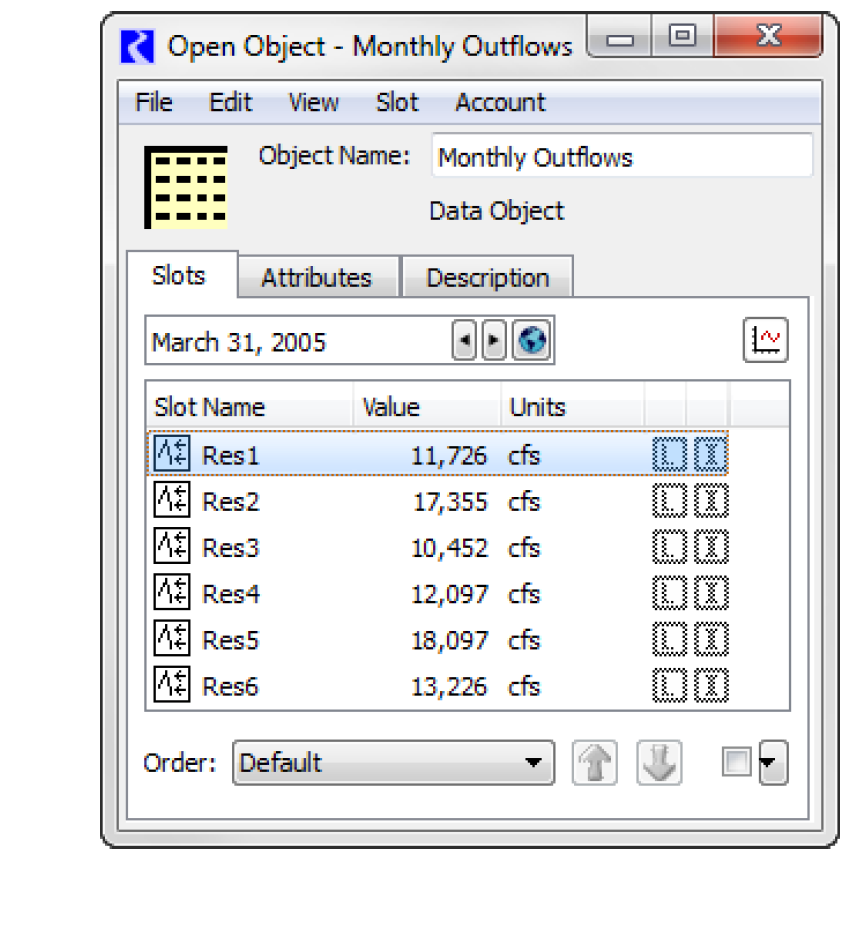 | 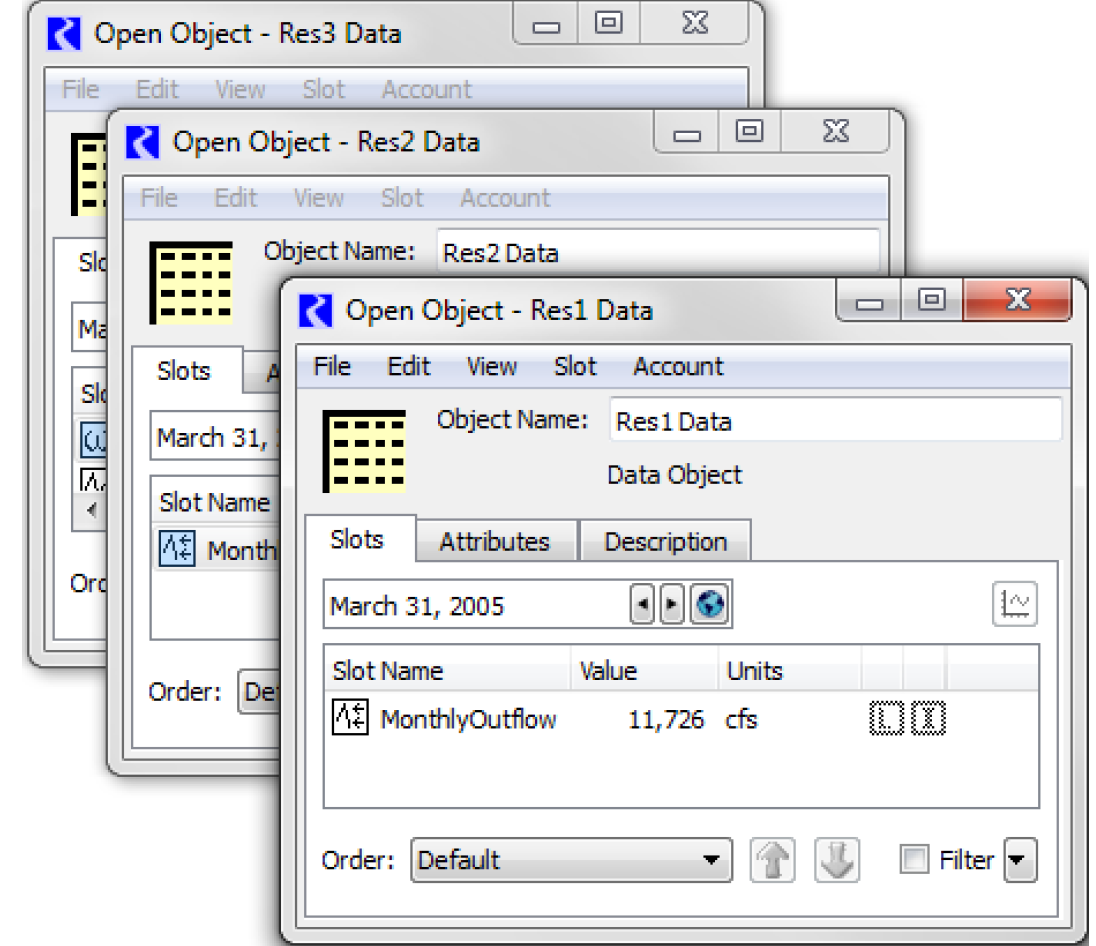 |
Advantages | |
This structure keeps all the data in one place. In addition, for Time Aggregation Series Slots, you can use the Create Similar Slots for Different Objects functionality. This setup works especially well for Tabular Series Slot Reports. See Creating Similar Time Aggregation Series Slots for Different Objects in User Interface for details. | Having one data object per object provides a place for all user defined data in one location. Creating custom slots directly on the simulation object keeps all the data in one place. Either format works well for Charts and the Output Canvas. |
Disadvantages | |
This structure does not support Charts or the Output Canvas. These two devices assume data is on each objects or an associated data object. | It is harder to create or add a slot to many objects once they are created. This can be mitigated by selecting Copy Slots to Objects functionality. See Copy Slots to Objects in User Interface for details. |
Naming Conventions | |
Make sure to use the same naming convention for the slots as you do for the Objects | Make sure to use a consistent naming convention for slot names so they are accessible by the Output devices. |
Revised: 01/10/2022