
SCT Layout
The SCT is a separate RiverWare window that you can open, resize, and position to suit your workflow. Figure 2.1 is an illustration of the main sections of the SCT.
Topics
General layout
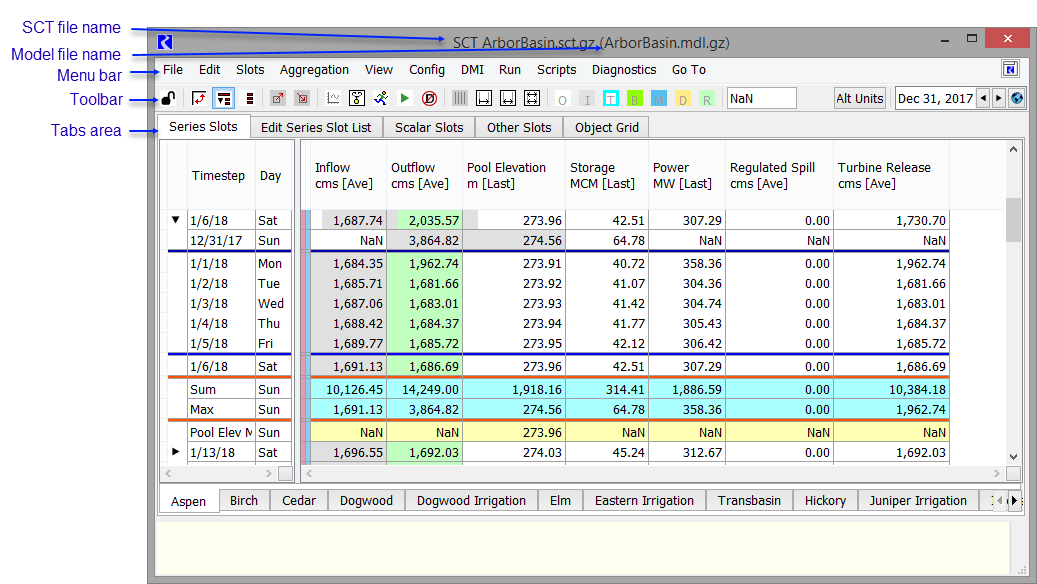
Figure 2.1 illustrates the general layout of the SCT.
The SCT file name is in the top border of the window. The model file name is shown in parenthesis.
The menu bar provides access to most SCT functions. Some functions are available from context-sensitive shortcut menus within the SCT.
The toolbar provides quick access to common SCT menu functions. You can customize the toolbar to include the buttons you use most frequently and hide the ones you do not need. User-configurable buttons include actions and cell value type flags.
The tabs area includes five tabs that are used to view, configure, and edit different types of data.
You can also selectively show or hide the Diagnostics Output area in the SCT. See Diagnostics for more information.
Figure 2.1 SCT layout
Series Slots tab
This tab displays series slots, including AggSeries and table series slots, on physical simulation objects and accounting slots. It allows you to display series slots and manipulate their values.
Series data is displayed in a spreadsheet-like format, with timesteps on one axis and slots on the other. Each cell displays a value for the slot at that timestep. You can easily switch the orientation of the axes so the timesteps are listed either vertically, down the page, or horizontally, across the page. See Figure 2.2 and Figure 2.3 for illustrations.
Figure 2.2 Series Slots tab—Vertical timestep orientation
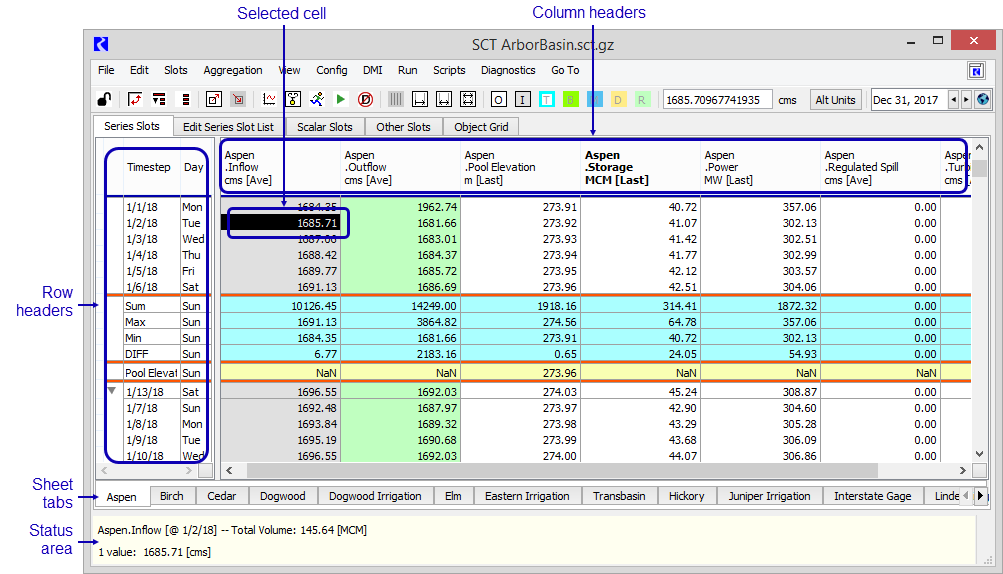
Figure 2.3 Series Slots tab—Horizontal timestep orientation
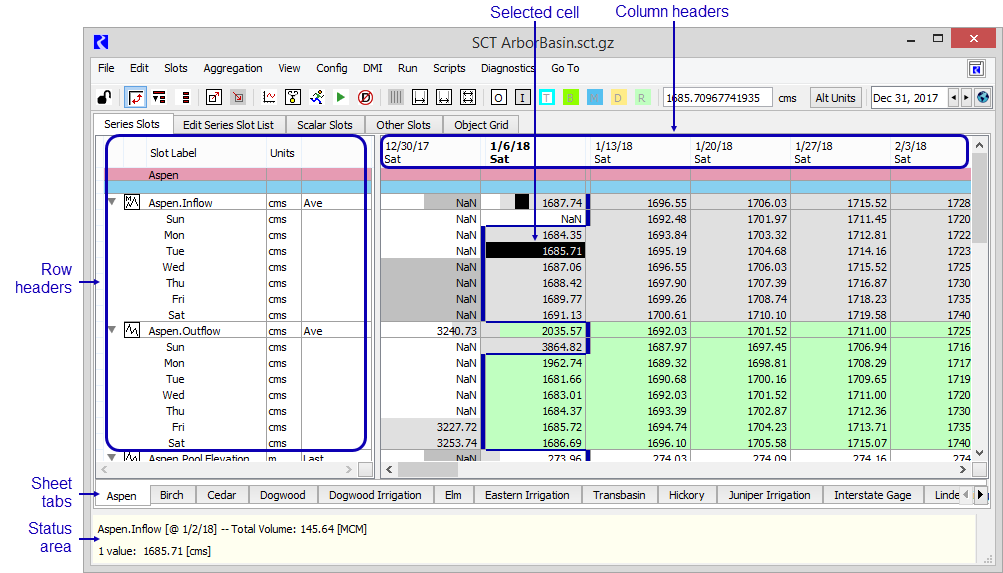
The background color of each cell typically identifies the Flag, which indicates how the value in the cell was calculated or assigned. For example, there is one color for Input (I) values and another for Output (O). You can optionally customize these flag background colors. Alternatively, you can create color alerts that change colors as the values cross thresholds.
Optionally, you can aggregate timestep values according to a variety of user-selected summary functions, including average, median, minimum, maximum, first, and last. After defining an aggregation interval for the entire SCT, you can assign summary functions by slot or by unit type.
The Status area, at the bottom of the Series Slots tab, alternates between the following displays.
• Selection summary information. Most of the time, the Status area displays detail on selected cells, including the name or number of slots selected, and basic timestep statistics, such as Sum, Average, Median, Min, Max, Range, and Difference.
• Run status. When a simulation run is started, the Status area displays the run status, if the Show Run Status setting is enabled in the SCT configuration. This area also displays object dispatch information for the run; an icon displays the most limiting object dispatching condition in the run and the number of objects that meet this condition.
Related topics
Edit Series Slot List tab
This tab lists all series slots, slot group dividers, and sheet dividers that are displayed on the Series Slots tab. It allows you to organize these slots and configure slot value threshold alerts.
Note: You must unlock the SCT configuration to go to this tab.
Figure 2.4 Edit Series Slot List tab
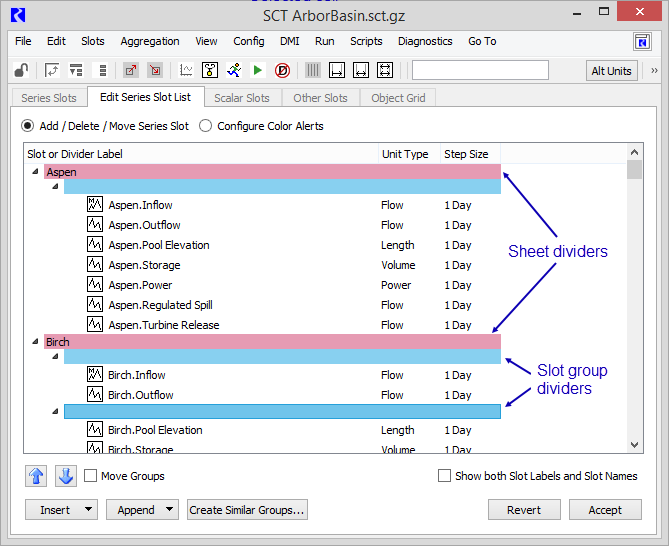
You can perform the following actions on this tab.
• Add, delete, and reorder slots.
• Organize slots into user-defined logical slot groups by adding and arranging slot group dividers.
• Organize objects and slots into multiple sheets by adding and arranging sheet dividers. Each sheet is accessible from a tab at the bottom of the Series Slots tab.
• Copy the structure of a selected slot group or sheet to other, similar objects.
• Configure custom, labeled colors for cell text and background.
• Configure alerts that automatically apply a custom color when slot values have reached or exceeded a specified threshold.
Related topics
Scalar Slots tab
This tab displays scalar and 1x1 table slots. It provides a single convenient location for you to track, organize, and edit these slots.
Note: 1x1 table slots were used for scalar values before scalar slots were implemented.
Each slot appears on a separate row. The object icon identifies the object type, and the slot icon identifies the slot type. The current value and unit type for the slot are also displayed.
Figure 2.5 Scalar Slots tab
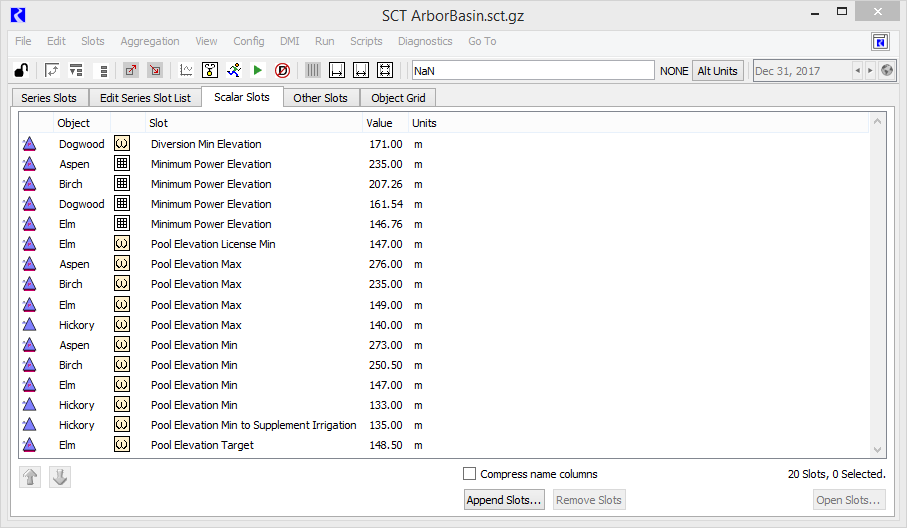
You can perform the following actions on this tab:
• Add, delete, sort, and reorder scalar slots.
• Set slot values directly; alternatively, you can open slots in the Slot Viewer and edit values there.
Related topics
Other Slots tab
This tab displays a list of table slots, periodic slots, list slots, and statistical table slots. It provides a single convenient location for you to track and organize these slots.
Each slot appears on a separate row in the list. The object icon identifies the object type, and the slot icon identifies the slot type. The number of rows and columns and the column labels are also displayed.
Figure 2.6 Other Slots tab
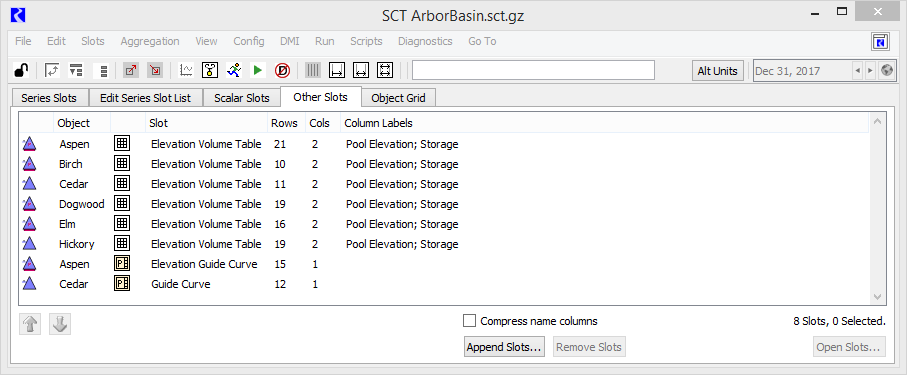
You can perform the following actions on this tab:
• Add, delete, sort, and reorder slots.
• Open slots in separate Slot Viewer windows. While you cannot edit slot values directly on this tab, you can edit values in the Slot Viewer.
Related topics
Object Grid tab
This tab displays a user-configured grid of objects and their included scalar and single value table slots. It provides a convenient location for you to organize and specify parameters on objects that interact with one another.
Each cell on the object grid represents an object, and each cell includes a user-specified list of scalar slots and single-cell table slots, called cell slot lists. You can add and arrange the objects and slots to fit your needs.
The object grid is particularly useful for a groundwater or aquifer network, in which the physical characteristics of the objects are related to one another. It is a useful tool when calibrating these types of systems, particularly when they become more complex.
Figure 2.7 Object Grid tab
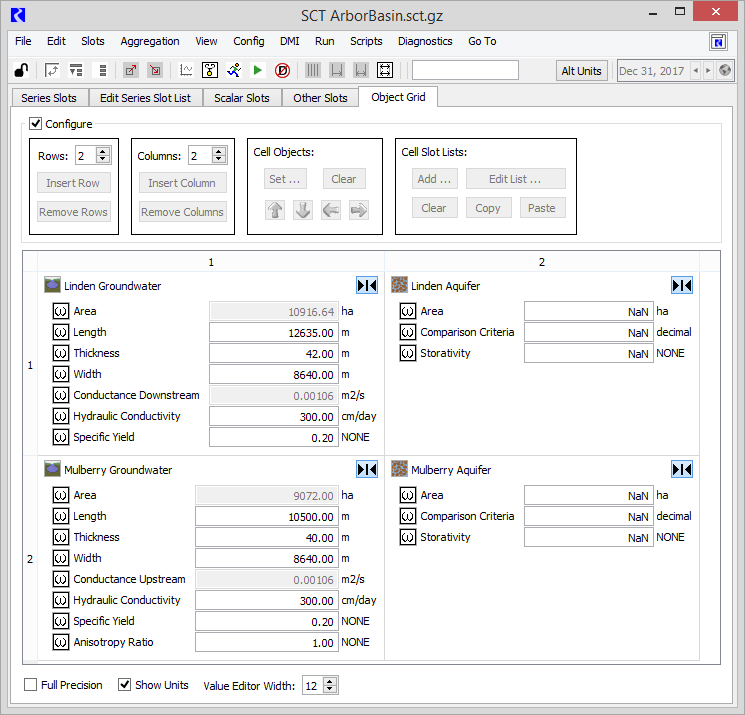
You can perform the following actions on this tab:
• Create a grid of objects with a specified number of columns and rows.
• Add, delete, and arrange objects in the grid.
• Open objects in the Object Viewer.
• Add, delete, and order slot lists for each object.
• Set slot values directly; alternatively, you can open slots in the Slot Viewer and edit values there.
The slots in a cell slot list are displayed in one of the following ways:
• Scalar slots and single-cell table slots are displayed with an active slot type button and a value, which is editable.
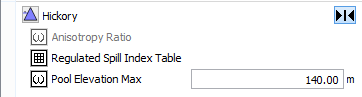
• Slots that do not exist on the object are not available (dimmed).
• Table slots with more than one cell are displayed with an active slot type button and no value.
Related topics
Revised: 01/10/2022