View Results
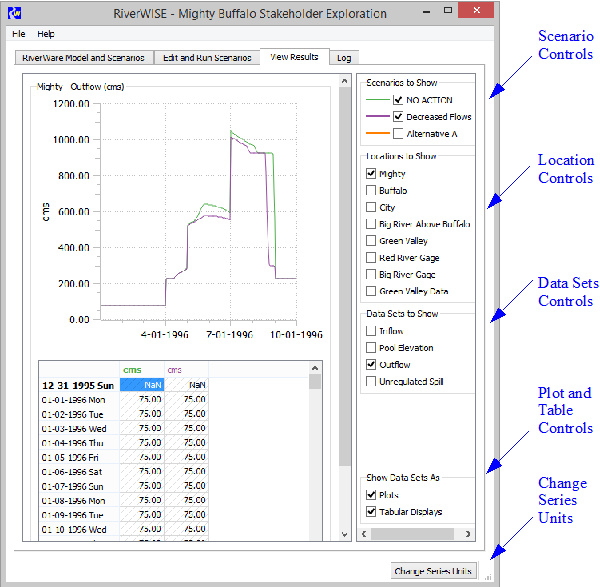
The View Results tab presents the result data sets for selected scenarios in current list. Figure 1.7 identifies the main areas of the screen.
Checkboxes in the following groups provide display filters based on several attributes.
• Scenarios to Show. Select the checkboxes to show data for the desired scenarios. These controls also provide a color legend for plots and tables (column headers)
• Locations to Show. Select the checkboxes to select the desired basin locations.
• Data Sets to Show. Select the checkboxes to indicate which data sets will be shown. Only data sets associated with currently shown locations are shown.
• Show Data Sets as. Choose to show data as either tables or plots.
• Change Series Units. Choose to show series data contain flows as volumes or vice versa. See Series Units for more information.
By default the series results data are shown as plots and tables; either the plot or the table displays can be hidden by clearing the appropriate checkbox to the lower right of the panel. See Plot Controls for details on plotting.
Figure 1.7 Screenshot of the View Results tab

Tip: To export all the results to Excel, use the File and then Export Results to Excel option as described in Export Results to Excel.
Revised: 07/09/2023