Output Utilities and Data Visualization
The following changes were made to output utilities.
Model Reports
The following changes were made to model reports.
New Item Type: Series Slot Notes Summary
A new item type was added to Model Reports: Series Slot Notes Summary. The table displays the information from the Note Instances panel of the Note Manager for all series slot notes in the model.
Figure 1.5 A Series Slot Notes Summary in a Model Report

For more information, see, Series Slot Notes Summary in Output Utilities and Data Visualization and Notes on Series Slots in User Interface.
Plotting
The following changes were made to plotting.
Video Tutorial
Want to learn more about using the plotting features? Check out our latest video tutorial at:
Fonts used on Plot Pages
Font settings and colors can now be changed on a plot-by-plot basis. Previously, fonts for plots were set for all of RiverWare. Now, you can configure the font family, size, and color for the title, axis, axis label, and legend to create beautiful plots like the following figure.
Figure 1.6 Plot Page with modified fonts and text colors
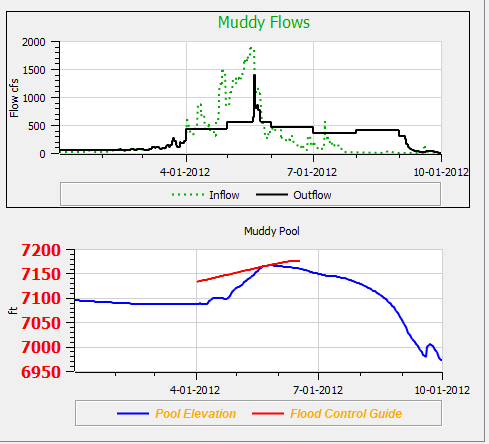
The font and color is configured in the individual item’s settings in the Plot Editor. For example, the Title font of the above plot is configured in the same place the title is specified:
Figure 1.7 Plot Title configuration with new font settings
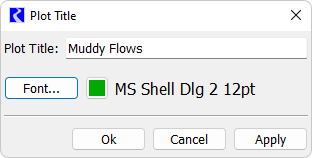
Also, use the Configure Multiple Plots and Curves utility to change the font across all plots in a Plot Page. For more information, see Configuring Multiple Plots and Curves in Output Utilities and Data Visualization
Finally, the previous RiverWare-wide settings for fonts are now the defaults for new plots. See Common Configuration in Output Utilities and Data Visualization for more information on configuring the defaults.
Warning Icons
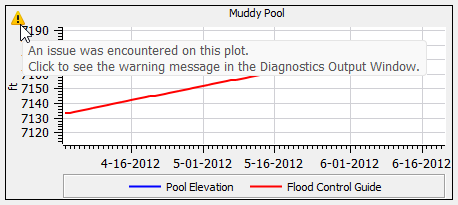
As shown in Figure 1.8, warning icons are now displayed in the upper-left corner of a plot if certain errors are encountered while drawing the plot such as invalid slot references or RPL execution errors. These errors are also written to the Diagnostics Output Window; selecting the warning icon opens the diagnostics output.
Figure 1.8 Plot showing warning icons
Plotting Snapshot Slots
Plots have been enhanced to more easily show snapshot slots associated with the source slots in the plot. This makes it easier to compare results from runs preserved with snapshots.
• See Snapshots for related enhancements to snapshots.
• See Snapshots in the SCT for related enhancements to the SCT.
Plots have been enhanced in the following manner to display snapshot slots:
The Snapshot button has been added to the Plot Page window.
Figure 1.9 New snapshot button on a plot page
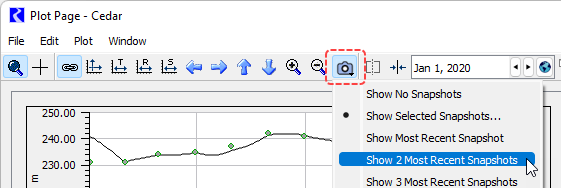
Selecting the Snapshot button presents a menu with the following options.
• Show No Snapshots - this is the default behavior. There is no automatic display of snapshot slots.
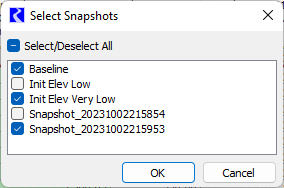
• Show Selected Snapshots—this option opens the Select Snapshots dialog where you can select which snapshots you want to display.
Figure 1.10 New Select Snapshots utility
• Show N Most Recent Snapshots—this option will show slots from the most recent snapshots, where most recent is based on the timestamp from when the snapshot was created.
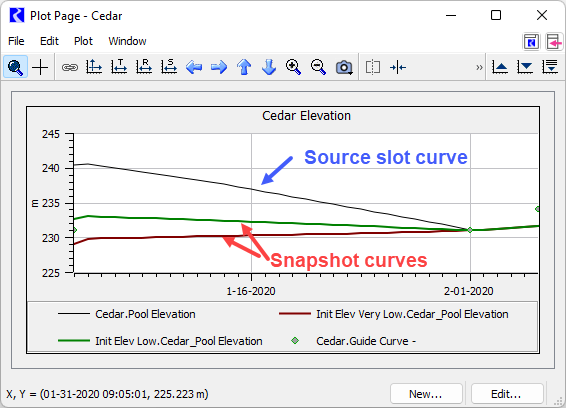
When one of the Show Recent Snapshots options is selected, if any slots in preconfigured plots are source slots for slots in the selected snapshots, then the associated snapshot curves are displayed in the plot together with the source slot.
Figure 1.11 Plot with multiple snapshot curves
See Adding Associated Snapshot Curves in Output Utilities and Data Visualization for more information.
Revised: 01/05/2024