Chart Display
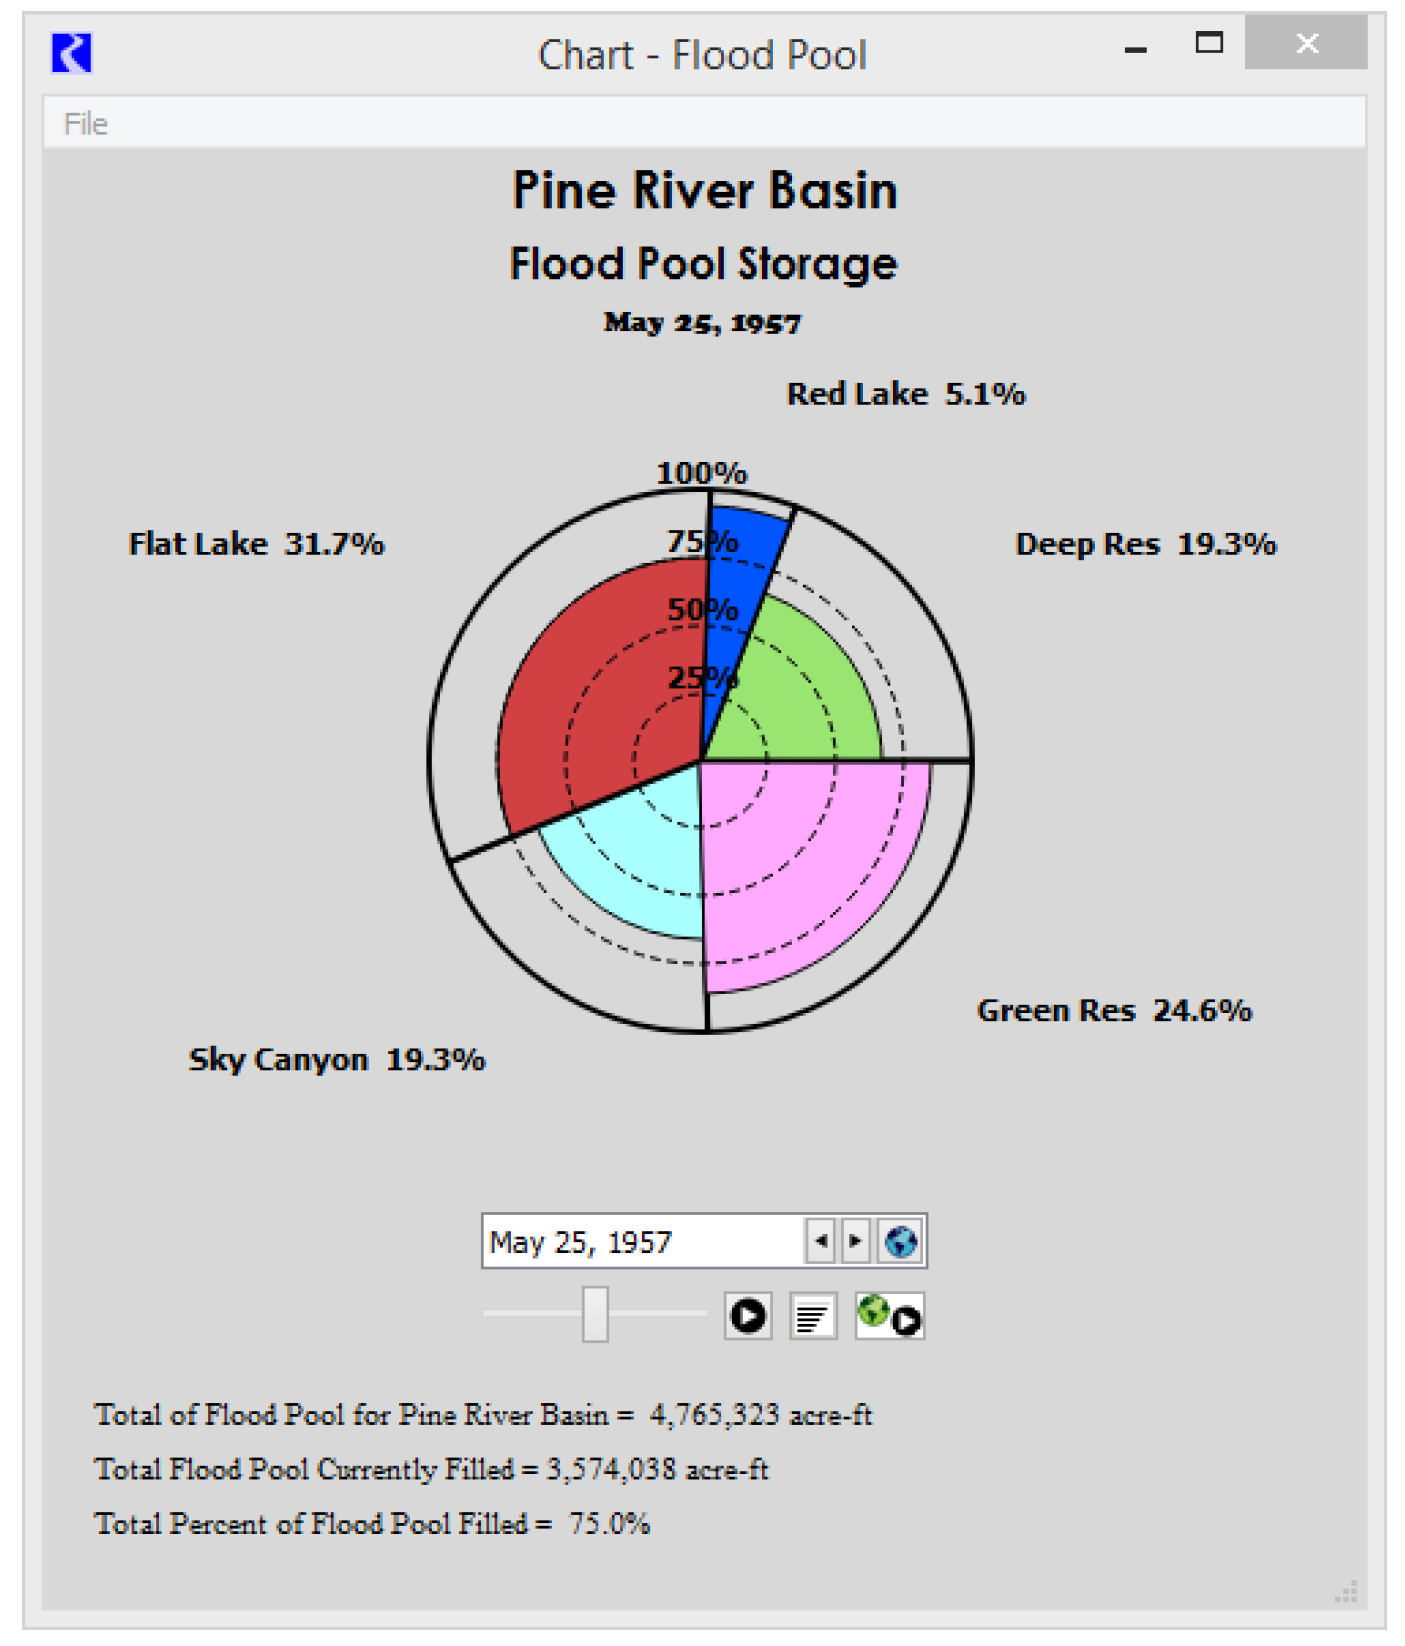
When a chart is generated from the chart configuration dialog or from the Output Manager dialog, a chart display dialog is created. Figure 5.8 is a pie chart with a linear radial dimension.
Figure 5.8

If series or periodic slot data are being displayed, the timestep date for the display is listed under the subtitle. Optional notes that are specified in the configuration are displayed starting in the lower left corner.
Revised: 01/05/2024