Output Devices
This section describes changes to RiverWare Output and Plotting.
Plotting: Mouse Button Actions
Mouse-wheel and button operations have been added to plots to improve panning and scrolling navigation.
• Mouse-wheel scrolling over the plot area zooms the plot in or out on all axes.
• Mouse-wheel scrolling over an axis scrolls only that axis. This single axis scroll not only improves ease of zooming a single axis, but also introduces a new capability of zooming an x or y plot axis independently from its opposing x or y axis, if one exists.
• Middle-mouse button click-and-drag action on the plot area pans the plot using a closed-hand cursor.
See Mouse Button Actions in Output Utilities and Data Visualization for more information.
Output Canvas
Following are new features in the Output Canvas.
Export to Video
The Output Canvas animation can now be exported to a video file (MP4, WEBM, WMV, or GIF). See Export Video in Output Utilities and Data Visualization for more information.
Flow Line Legend
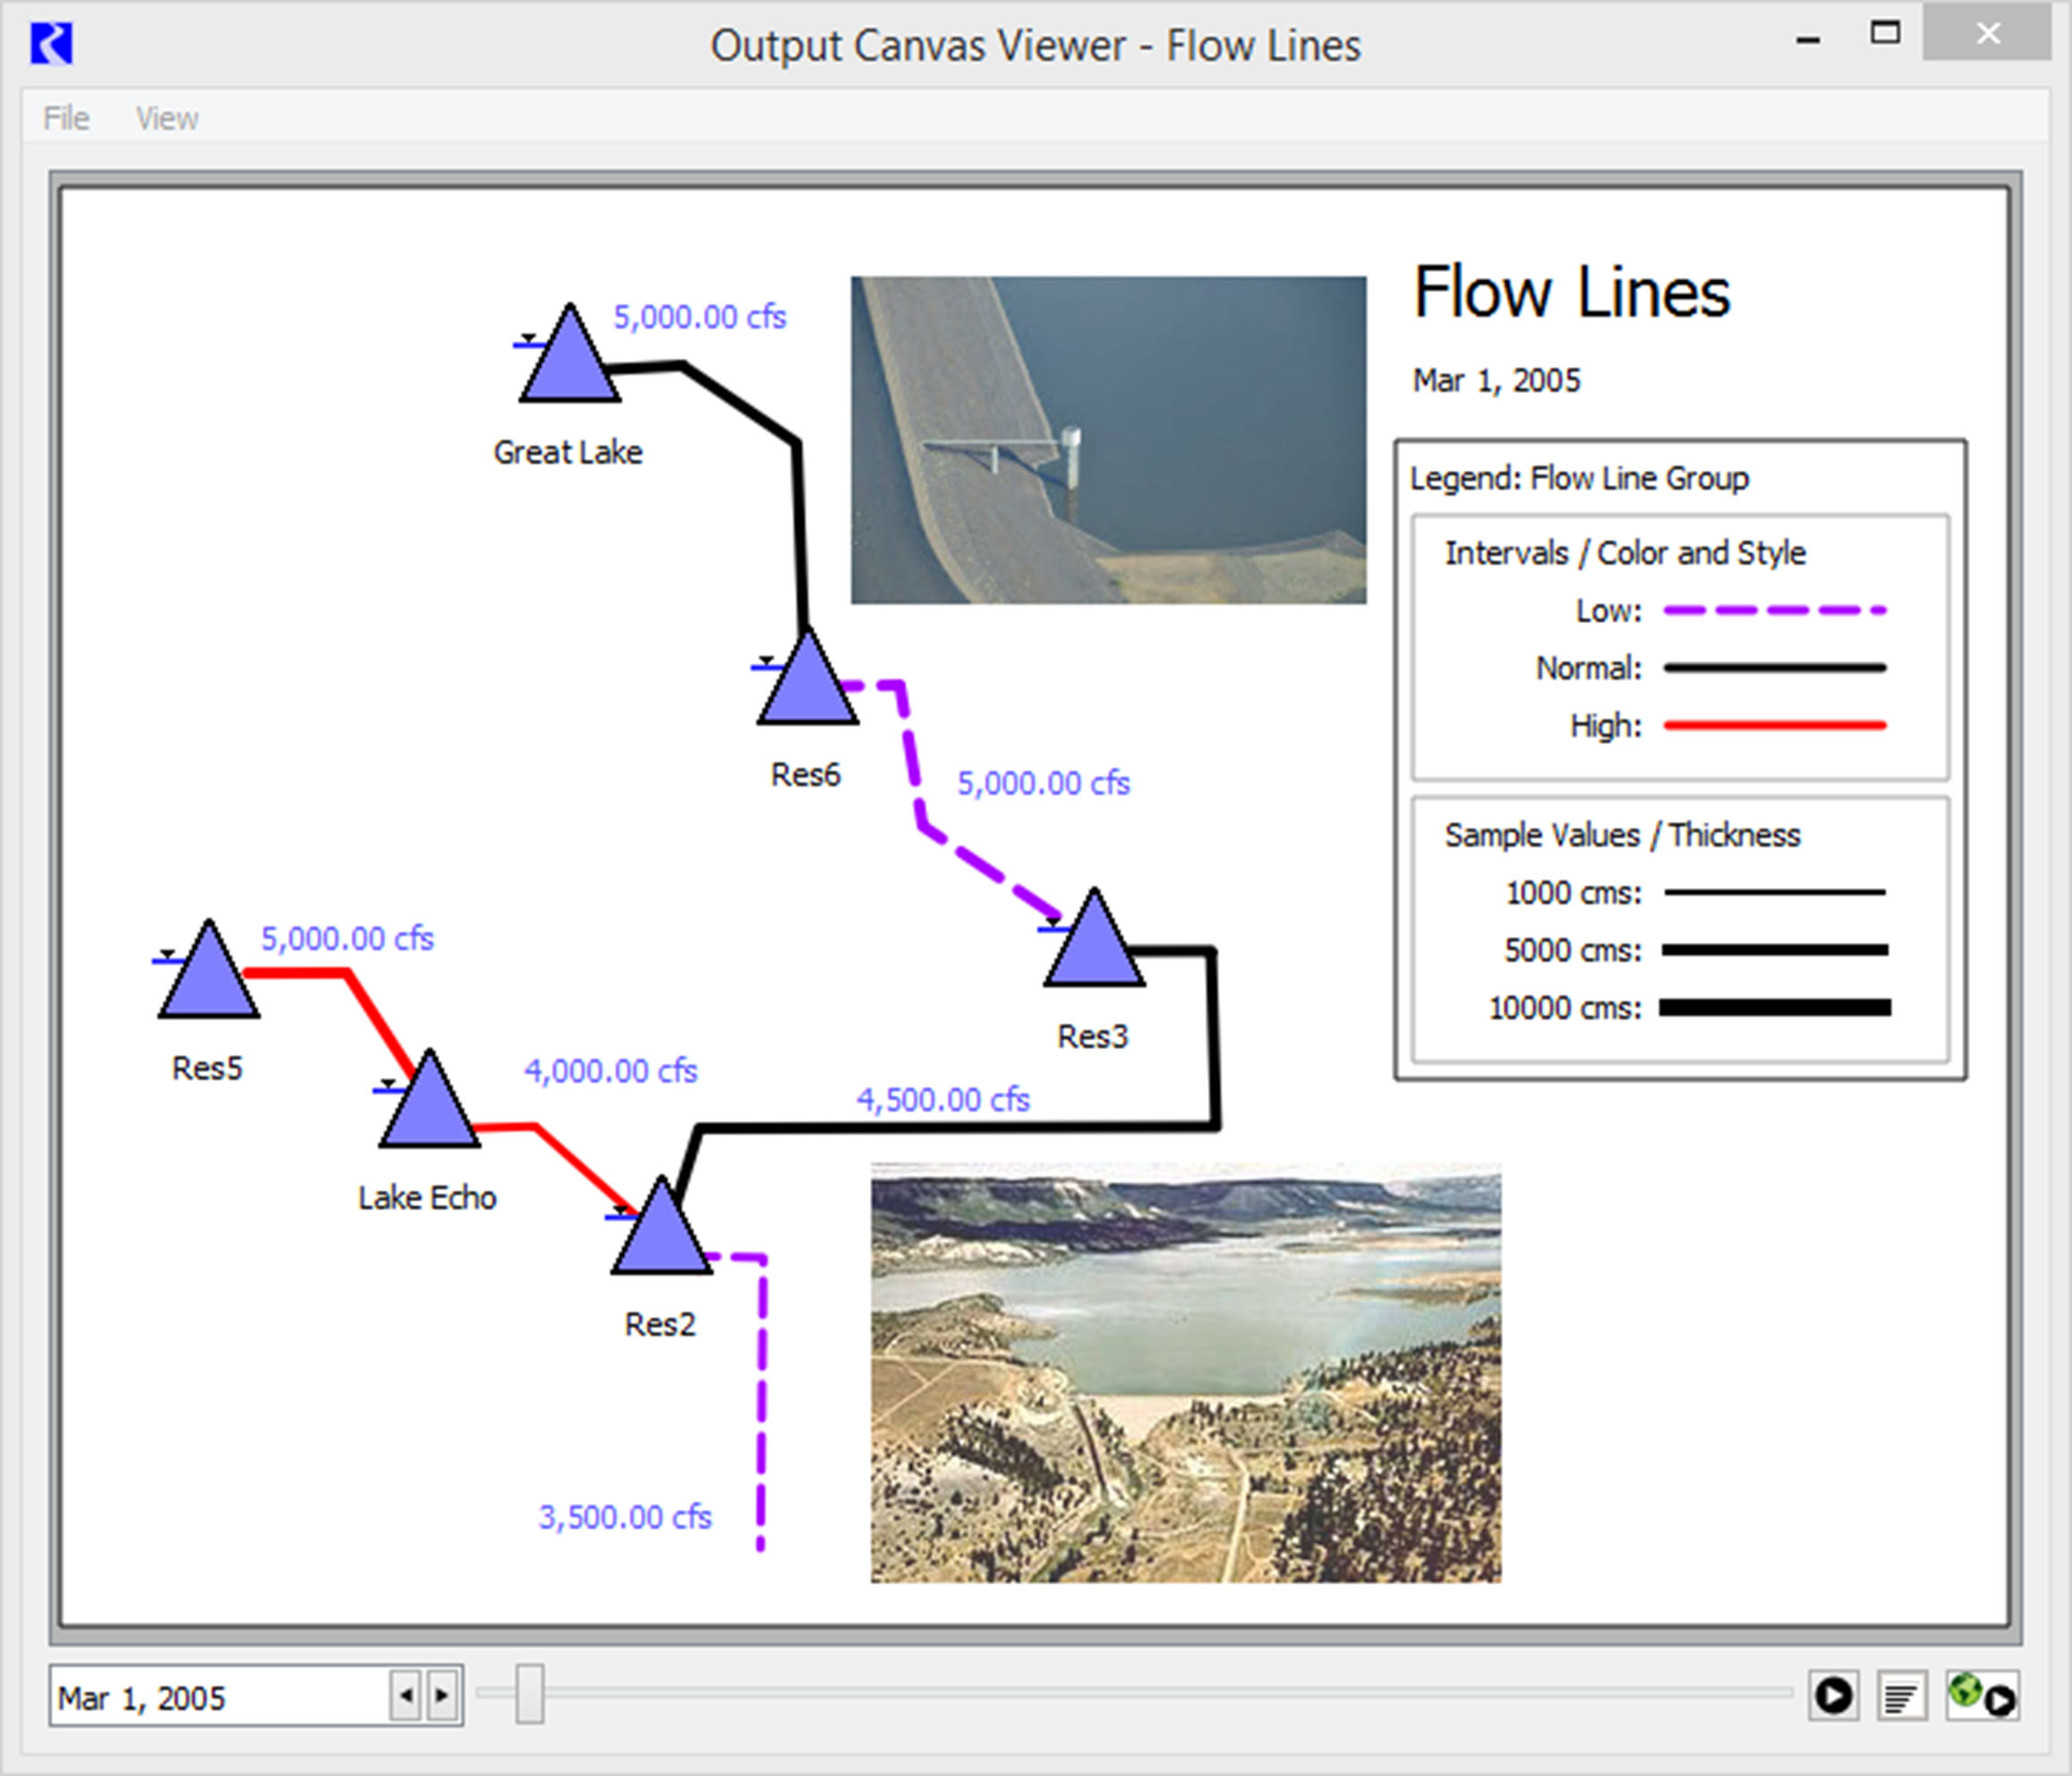
On the Output Canvas, you can now show a Flow Line Legend as part of a Flow Line Group. The legend provides a key to the defined intervals on the Flow Line Group and sample line thicknesses corresponding to values. Figure 10.3 shows an output canvas with Flow Lines and a Flow Line Legend. See Flow Line Legend in Output Utilities and Data Visualization for details.
Figure 10.3 Output Canvas that includes a Flow Line Legend

Revised: 01/05/2024