Simulation
The Model Run Analysis utility provides post-run diagnostics regarding object dispatching and known values of dispatching slots at every timestep of the simulation. The Model Run Analysis dialog is invoked by selecting Model Run Analysis from the Utilities menu or by selecting the Run Analysis shortcut button on the toolbar.

The Model Run Analysis tool provides dispatch information at two levels of detail. At the workspace level, the dispatch state of each object for each timestep of the model run is visible. At a more detailed level, the tool allows an object’s dispatch methods and known slot values at the end of each timestep to be viewed. Figure 2.1 shows a sample Model Run Analysis dialog.
Figure 2.1
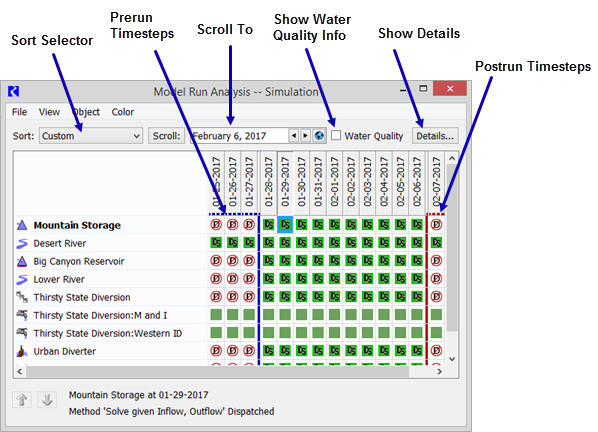
The Model Run Analysis—Simulation dialog displays the workspace-level view of dispatch conditions. This dialog consists of a two-dimensional matrix with workspace objects on one axis and model run timesteps on the other axis. The left-most part of the matrix, separated by a blue vertical line, indicates prerun timesteps. Post-run timesteps (when configured) are shown separated by a red line. Each cell in the matrix shows the dispatch state of an object at the indicated timestep. Dispatches are registered automatically during model runs; dispatch information is displayed when available. Because they never dispatch, Data Objects and Snapshot Objects are not included in the list of Objects.
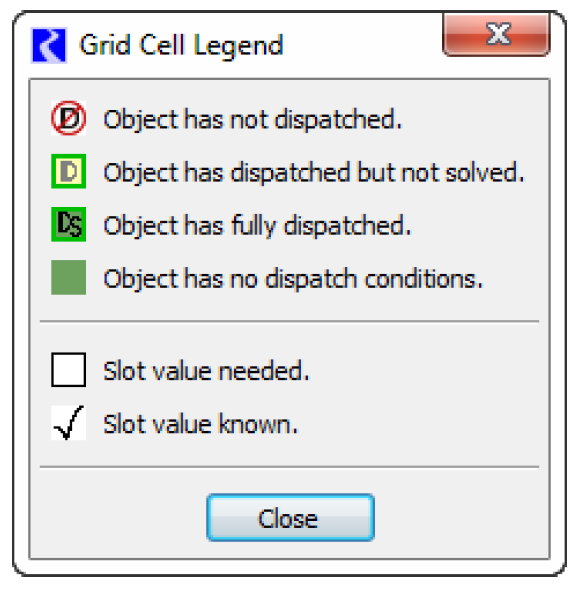
An Object has one of four possible dispatch states:
•  Object has not dispatched. The known and unknown slots for the timestep did not meet the requirements of any method on the dispatch table for the Object.
 Object has not dispatched. The known and unknown slots for the timestep did not meet the requirements of any method on the dispatch table for the Object.
•  Object has dispatched but not solved. Conditions of a single method on the dispatch table were met; the method dispatched, but the Object did not solve completely. (in yellow)
 Object has dispatched but not solved. Conditions of a single method on the dispatch table were met; the method dispatched, but the Object did not solve completely. (in yellow)
•  Object has fully dispatched. Conditions of a single method on the dispatch table were met; the method dispatched, and the Object solved.
 Object has fully dispatched. Conditions of a single method on the dispatch table were met; the method dispatched, and the Object solved.
•  Object has no dispatch conditions. The Object has no entries on its dispatch table, the Object has no dispatch conditions (e.g. Gage Object or Thermal Object), or the model has not been run.
 Object has no dispatch conditions. The Object has no entries on its dispatch table, the Object has no dispatch conditions (e.g. Gage Object or Thermal Object), or the model has not been run.
Model Run Analysis Dialog
Following is a tour of the model run analysis dialog.
Sorting
The object list can be sorted using a variety of methods, as follows.
Sort Menu
The order in which Objects appear in the dialog may be rearranged from its original alphabetical order. The Sort pull down menu allows the user to sort the objects by:
• Custom. The user may define a custom order using the Up and Down arrows. 

Initially, the objects are arranged by the internal ordering of the objects in the model file, as defined by the order in which objects were created.
• Name. Alphabetical
• Type. Arrange by the object’s type. The types are then arranged alphabetically.
• Position. Arrange using the workspace layout to arrange the objects top to bottom based on y-coordinate (This assumes objects in the basin go top to bottom and the Run Analysis tool is displayed “Time on Top”)
• Custom from Workspace. Use the custom order created on the Workspace Object List. See Object List in User Interface for details.
Move Object Up and Down buttons
The Up and Down arrows are used to move one or more selected objects up or down in the list.
These buttons are only available for the Custom sort order. When using any of the other sort orders (Name, Type, Position) the Set Order button is displayed and active. This button sets the currently displayed order as the new Custom order, switches the sort menu to Custom, and enables the Up and Down arrows. A warning message dialog is presented to alert the user that the custom order will be overwritten. This functionality allows the user to first sort by one of the common approaches, save the order as custom, then make detailed changes using the Up and Down arrows. Any further changes to the Custom order are saved automatically.
Scroll To
The Scroll To button allows the user to enter a date or use the datetime spinner to select a date. Selecting Scroll moves the dialog to that date.
Water Quality Dispatch Information
When water quality is enabled, the Water Quality checkbox is displayed on the main grid dialog and the WQ checkbox is shown on Dispatch Details dialogs. When enabled, the Water Quality dispatch information is shown instead of the water quantity dispatch information. See Viewing Water Quality Dispatch Information in Water Quality for details.
Time on Top and Time on Side
The Model Run Analysis tool can be shown with either time on the top or time down the side. In the View menu, the chosen option will have a check mark next to it.
Rules Grid
Even for a simulation model, the user can select to show the Rules Grid from the View menu. This can be useful when switching between the simulation and rulebased simulation controllers. Showing the Rules Grid provides additional information on the priority of the rules that set slots. See Main Analysis Dialog for details.
Show Object Icons
In the View menu, the user can select Show Object Icons. When checked, the icon for each simulation object is shown in on the tool. This option is only available when shown in the Time on Top configuration. For the Time on Side configuration, object icons are never shown.
Update After Every Timestep
In the View menu, the user can select the Update After Every Timestep option. If this option is selected, the utility, when opened, will be updated after every timestep. For models with many objects or timesteps, this processing can be very time consuming and lead to adverse performance. For large models, it is advisable to turn this option off or keep the Model Run Analysis utility closed until the model has stopped running.
Note: The utility is always updated when the run stops. For small models, this option can remain checked.
Pre-run Timesteps
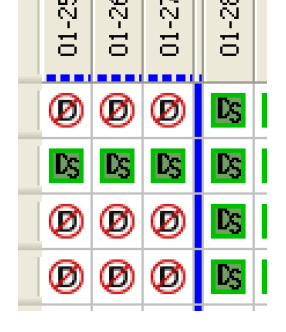
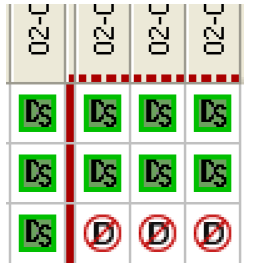
Timesteps before the start timestep are displayed with a blue dotted line below and to the right of the timestep label. Also, there is a blue separator line between the initial and start timestep. Only certain objects (reaches, confluences, control points, and stream gages) dispatch during prerun timesteps,. Thus, most objects indicate they have not dispatched during the prerun period.
Post-run Timesteps
Timesteps after the finish timestep are displayed with a red dotted line below and to the right of the timestep label. Also, there is a red separator line after the finish timestep. Post-run dispatching is enabled on the run control parameters. See Number of Post-Run Dispatch Timesteps (Simulation) and Number of Post-Run Dispatch Timesteps (RBS) in User Interface for details.
Legend
A legend used in the Model Run Analysis can be displayed by selecting View, then Grid Cell Legend.
Dispatch State
Selecting an Object or timestep cell displays its dispatch state in text form at the bottom of the Dispatch Information dialog. If the Object dispatched at that timestep, then the name of the method under which it dispatched is also displayed.
Context Menus
On the Model Run Analysis, right-click context menus are available to Show Dispatch Behavior Details, Show Special Results Details, Open Object, Disable Dispatching, Copy Time, and Global Scroll.
Disabling Dispatching
The Model Run Analysis dialog may be used to disable or enable dispatching for individual Objects. Disabling dispatching prevents the object from dispatching at any timestep, regardless of what slots are known. The Object’s Beginning of Run behavior, however, may never be disabled. This functionality is useful to debug models. To disable dispatching for an Object, select its name and select Object, then Disable Dispatching from the Model Run Analysis dialog menu bar. The Object name is shaded with red diagonal lines to indicate that it will no longer dispatch. Also, the object icon on the workspace and on other dialogs is dimmed. See Enabling and Disabling Dispatching in User Interface for details. To reenable dispatching, select the name of the Object for which dispatching has been disabled and select the Object, then Enable Dispatching.
Details Dialogs
From the Model Run Analysis tool, you can see additional information for any object at any timestep. The information available depends on the model’s controller and other selections.
Dispatch Behavior Details Dialogs
The Dispatch Behavior Details dialogs allow the entries in the dispatch table and the known slots at the end of each timestep to be viewed for each object. To open a Dispatch Behavior Details dialog, select and open a cell in the Model Run Analysis dialog that represents the desired object and timestep.
The Dispatch Behavior Details dialog has two views. The default view depends on the dispatch state of the selected object/time. Figure 2.2 shows a sample of each view.
Figure 2.2
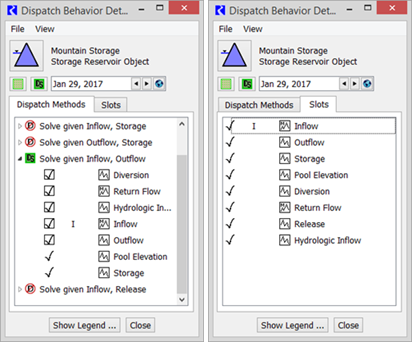
If the Object has no dispatch conditions, or the model has not yet been run, a blank dialog is shown.
If the Object did not dispatch during the selected timestep, the Dispatch Behavior Details dialog appears showing the Slots tab. Each of the displayed slots is a required known and/or a required unknown for one of the Object’s dispatch methods. The checkmarks indicate which slots were known at the end of the selected timestep.
To view the entries in the dispatch table (possible dispatch methods) for this object, select the Dispatch Methods tab. The Dispatch Methods view shows all of the methods in the Object’s dispatch table, each marked with a symbol indicating whether the method dispatched. Selecting the tree view to the left of a dispatch method name opens a list of its dispatch conditions. Slots in the list with a checkbox to their left are required knowns for the method to dispatch. Slots with no checkbox are required unknowns. Checkmarks indicate which slots were known at the end of the timestep.
If the object did dispatch during the selected timestep, the Dispatch Behavior Details dialog opens in the Dispatch Methods view. The method which dispatched at the selected timestep is marked with the dispatched symbol and is opened to show its dispatch conditions.
Note: All the slots are checked as known, even those required to be unknown. This occurs because the object solved correctly for all slots, making them known by the end of the timestep. We know that the dispatch conditions requiring unknowns were met at the time of dispatching because the method could not have dispatched otherwise. This may seem slightly confusing, but remember that the known/unknown status of particular slots is truly of interest only if the object failed to dispatch at the selected timestep. If the object did indeed dispatch, all of the conditions must have been met.
The Dispatch Behavior Details dialog contains a date selector which moves the detail view forward and backward in time. This is useful to determine how the set of known slots changes from timestep to timestep.
The Dispatch Behavior Details dialog can also be docked in the Model Run Analysis dialog. From the Model Run Analysis dialog, select Details. This adds the Dispatch Behavior Details dialog to the same window as the Model Run Analysis dialog. Figure 2.3 illustrates.
Figure 2.3
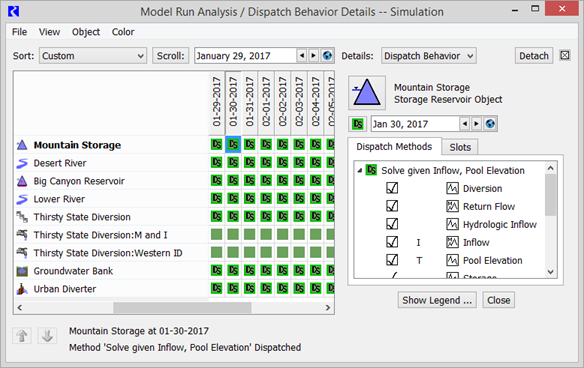
When docked, the dialogs can be separated using the Detach button. When in standalone mode, the Dispatch Behavior Details dialog can be docked from its File, then Dock in Model Run Analysis menu.
In the Dispatch Behavior Details dialog, selecting the Object icon brings up the Open Object dialog. Similarly, Selecting the icon  brings up the Model Run Analysis and docks the Dispatch Behavior Details dialog.
 brings up the Model Run Analysis and docks the Dispatch Behavior Details dialog.
Rule Effects Details Dialog
The Rule Effects Details dialog displays the names of all rules and whether each rule succeeded at the selected timestep. See Rule Effects Details Dialog for details.
Special Results Details Dialogs
The Special Results Details dialogs provide access to results for certain algorithms and computations. Currently the implemented special results are for USACE Methods. See Model Run Analysis—Special Results Details Dialog in USACE‑SWD Modeling Techniques for details.
Revised: 12/06/2024