Output, Plotting, and Model Reports
Model Reports
Model Reports Model Report in Output Utilities and Data Visualization allow you to generate a customized HTML document describing various aspects of a model including the configuration, RPL policy, slots, and plots. In the Model Report, the following new Item Types have been added:
• Output Device: Pie Chart
• Output Device: Tabular Series Slot Report
• Account System Information
• Account Section
• Account Table
• Supply Table
• Account Method Table
See Selected Item Settings Area in Output Utilities and Data Visualization for information on the Item Types.
Periodic Slot Improved Plotting of Time Range
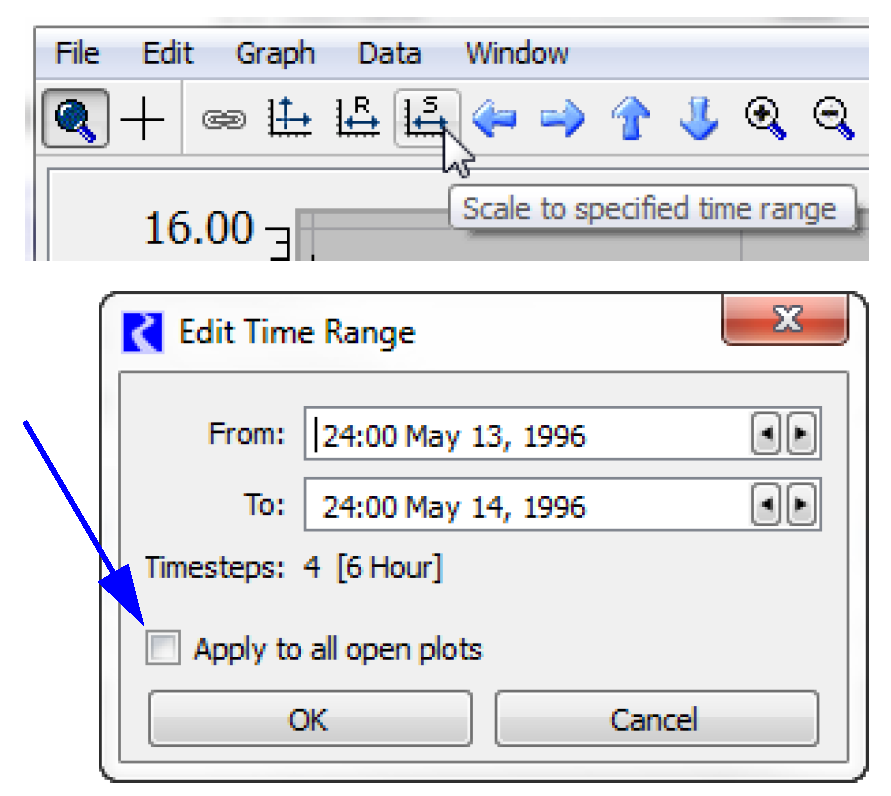
The plotting of Periodic slots has been improved so you no longer have to configure a time range to plot. Now, the periodic curve is shown for whatever range is plotted. If no other slots are plotted, the range defaults to the run range. Use the zooming tools to define the range including the Scale to Specified button to enter your desired range dates and apply it to many plots at once. This is describe more Pie Charts.
 to enter your desired range dates and apply it to many plots at once. This is describe more Pie Charts.
 Plotting of periodic slots is described in Parametric Curves in Output Utilities and Data Visualization.
Pie Charts
The following improvements were made to the Pie Chart output device Chart in Output Utilities and Data Visualization:
• Controls were added to animate the pie chart over the run.

• Background colors are now configurable for both the display and when exported/printed.
• Radial scale circles are dashed instead of solid.
• Commas are shown as the thousands separator.
• A right-click context menu was added to the configuration to allow you to Copy Slots and Paste Slots from/to the slot list.
• Pie charts were separated from their configuration dialogs; if the configuration is closed, the other is not.
• Redundant Pie Charts dialogs are no longer created when regenerating. Only one chart per device is shown.
• The stability of the pie chart was improved when the dialog is resized or changed to show a different timestep
Printing and Exporting
Plot Pages now have configurations options for the headers and footers that are shown when printed. Use the File Print Printed Header/Footer Configuration... For more information, see Printing and Exporting Plots in Output Utilities and Data Visualization.
Redundant Plots
When regenerating a plot from the Output Manager, duplicate plots are no longer created. The existing plot is updated.
Scale to Specified Time Range
The Scale to Specified Time Range button is shown to the right. Clicking the button opens the dialog below. Now there is the option to Apply to All Open Plots. This sets the visible range of all open plots to the specified range. Each plot would need to be saved to preserve that range.

Revised: 12/06/2024