Script Dashboard
The Script Dashboard is the main interface for executing the script. This dialog box presents the actions and controls for the script, although not all actions are necessarily shown. See Editing a Script for details about configuring the settings for each action. Each row in the dashboard represents an action. Within each action, the action display text, optional action description, and any user controls are presented.
Figure 1.29 identifies additional features of this dialog.
Figure 1.29 Annotated Script Dashboard
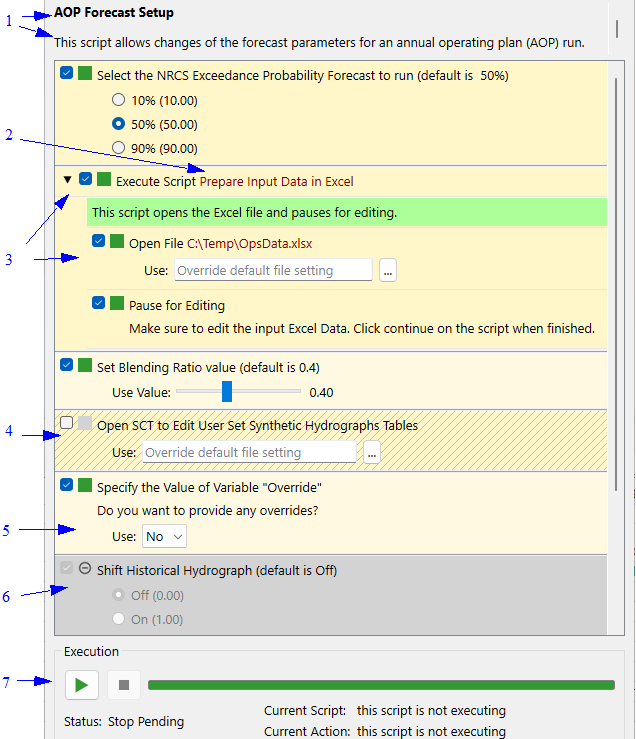
1. The script name and description are shown at the top.
2. The script variable values are shown in red. Editable values are shown as either text edit fields, buttons, or sliders.
3. Actions which are part of an Execute Script action (i.e. a subscript) are indented. See Display of Execute Script and Sub-actions for more information. The arrows can be used to expand or collapse those sub-actions. Each Execute Script action has a setting that indicates whether the sub-actions should be expanded (yes is the default) but the dashboard user can expand or collapse as desired. See Expand All and Collapse All in Operations for Actions on the Dashboard.
4. Disable an action by selecting the check box. This makes the row cross hatched. Use Edit, then Enable All Action to enable all actions shown in the dashboard at once; similarly Edit, then Disable All Action disables them all. Use the Edit, then Reset Values option to revert all values in the Script Dashboard back to the default value as defined in the Script Editor.
5. Specify script variable values using the menu or radio buttons. See Script Variable Values and Dependencies for more information.
6. Actions that are dependent on Script Variables are shown in gray when they won’t be executed. See Script Variable Values and Dependencies for more information.
7. To run the entire script, specify any desired override values (where configured) in the Script Dashboard and then select the Run button.

Executing Actions From the Script Dashboard
Use the following options to execute the script:
• Use the Start button to run the entire script.
• Use the Execute Action context menus to run a single action.
• Use the Execute Script Through This Action context menu to run the script from the start up to and including this action.
• Use the Execute Script from this Action context menu to run that action and the remainder of the script.
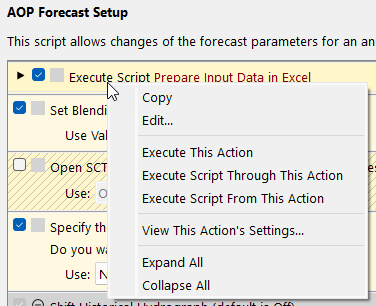
Figure 1.30 Shows the context menu options.
Note: The execute options are available for both actions in the main script and in sub scripts.
Figure 1.30 Screenshot of dashboard context menu operations
Operations for Actions on the Dashboard
Figure 1.30 shows three additional operations from the context menu on the dashboard:
• Copy: Use this menu to copy the action and its settings and then paste it into a Script Editor.
• Edit: Use this menu to open the Script Editor with this action selected. Then edit the settings in the Script Editor.
• Open Slots: For actions that involve slots (Set Series Slot, Open Slots, and so on), you can open those slots directly from the context menu.
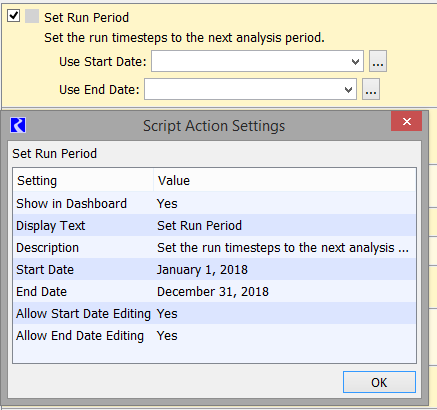
• View This Action’s Settings: Open a read-only dialog box that shows all of the settings for that action. This allows you to see the settings and configuration for this action without opening the Script Editor. Figure 1.31 shows a sample.
• Expand All: Show all sub-actions called by Execute Script actions.
• Collapse All: Hide all sub-actions called by Execute Script Actions.
Figure 1.31 Screenshot of the Dashboard and corresponding Script Action Settings dialog box
Progress and Status on the Dashboard
The Script Dashboard provides a progress bar at the bottom of the dialog showing the current action and the overall progress (based on the number of actions). As script actions execute, the Script Dashboard scrolls to keep the currently executing action in view.
A rotating icon to the right of the Enable/Disable checkbox and darkened frame progress through the script to indicate the currently executing action. For Execute Script actions, both the Execute Script action and any sub-actions shown the same.

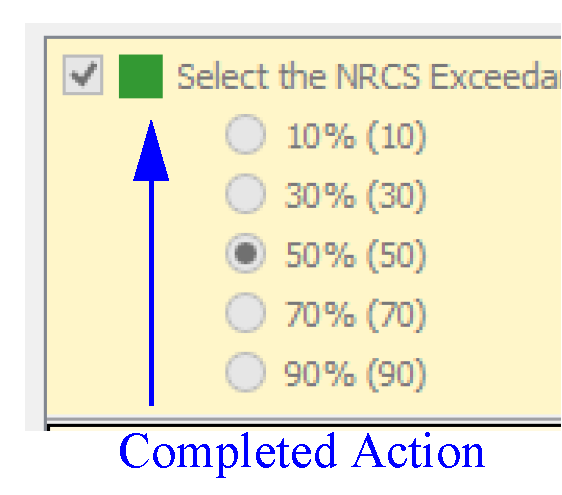
Actions that have completed successfully are indicated by a small green square to the right of the Enable/Disable checkbox.
Actions resulting in an error, show a red square indicator.

A partial green square indicates that some but not all actions in a subscript were executed.

A subset of actions in a subscript can be executed using the “Execute This Action” or “Execute Through/From This Action” operations on the context menu as described in Executing Actions From the Script Dashboard. If only some of the actions are executed, any upper level, calling scripts will have this partial green square as the status.
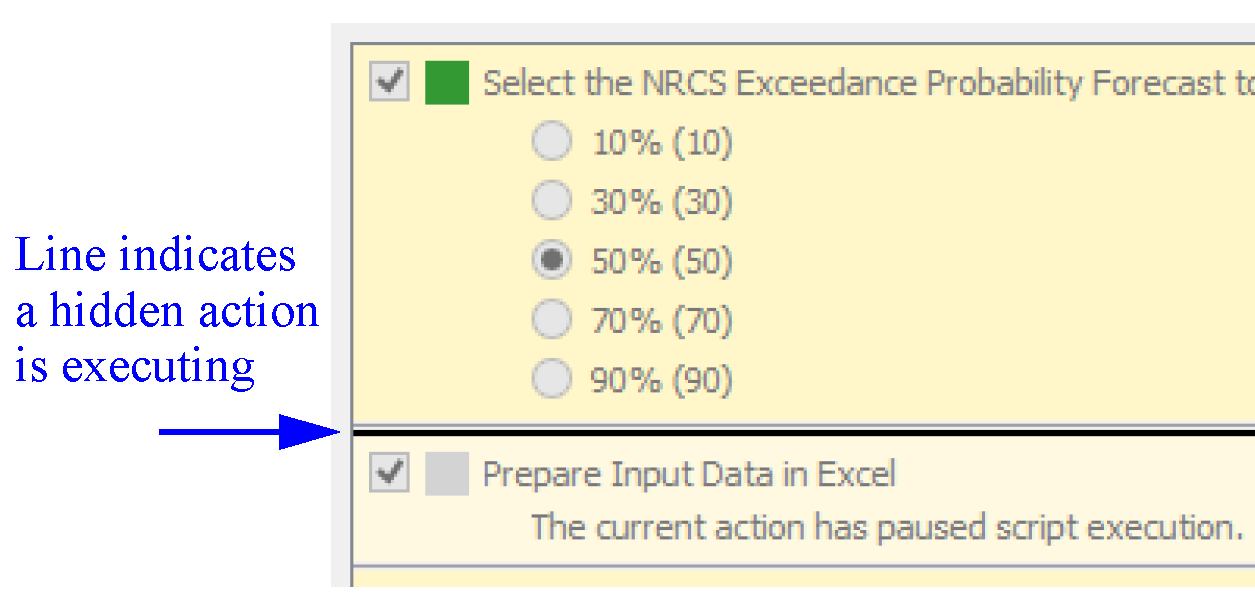
During script execution, a dark horizontal line between actions indicates a hidden action (one that is not shown in the dashboard as configured in the editor) is executing.
If the script fails or a Memo with confirmation is encountered, a dialog will open alerting you.
When paused in a Memo action, the Dashboard shows an orange arrow on both the Memo action and the calling Execute Script action, if necessary.
For the Memo, you must select the Continue button to resume execution.
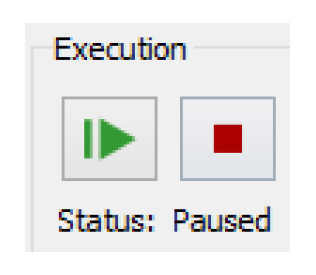
Note: The script developer can specify which actions are shown on the Script Dashboard. Therefore, the dashboard may not contain all the actions executed by the script.
Display of Execute Script and Sub-actions
A script can call another script using the Execute Script actions. Up to 5 levels (5 Execute Script actions) are supported. Actions called as part of an Execute Script are termed sub-actions. This section explains some of the behavior supported for sub-actions in the dashboard.
Note: Sub-actions are not shown in the script editor.
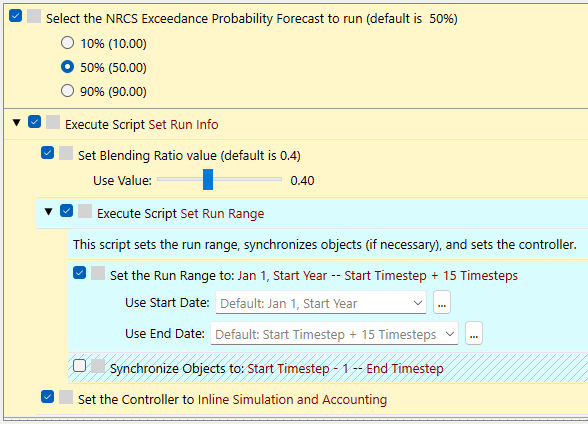
Figure 1.32 shows a script with two levels of sub-actions. Set Run Info calls Set Run Range (light blue background) Notice that all sub-actions are indented including the dividers and disabled status background. Use the override controls to modify the sub-actions as desired.
Figure 1.32 Screenshot of a script dashboard with multiple levels of Execute Script actions
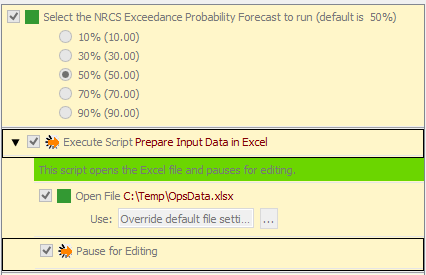
When the script is paused in a sub-action, the dashboard shows that information as shown in Figure 1.33. Notice the orange arrow that indicates the top level script(s) and sub-action at which execution is paused due to a Memo action.
Figure 1.33 Screenshot of a script dashboard paused in a sub-action
If an error occurs during the execution of a sub-action, then all Execute Script actions that it is nested under will also be marked as having an error to aid in locating the source of an error in a large script.
The script execution control panel also displays the currently executing script in addition to the currently executing action to aid in identifying the specific action that is executing. This is especially useful in scripts in which the same action is executed multiple times under different Execute Script actions.
Revised: 01/10/2025