Plotting
The following changes were made to Plotting.
Axis Date/Time Format
See the special attention note about Plot Date/Time Formats.
Curve Configuration Window
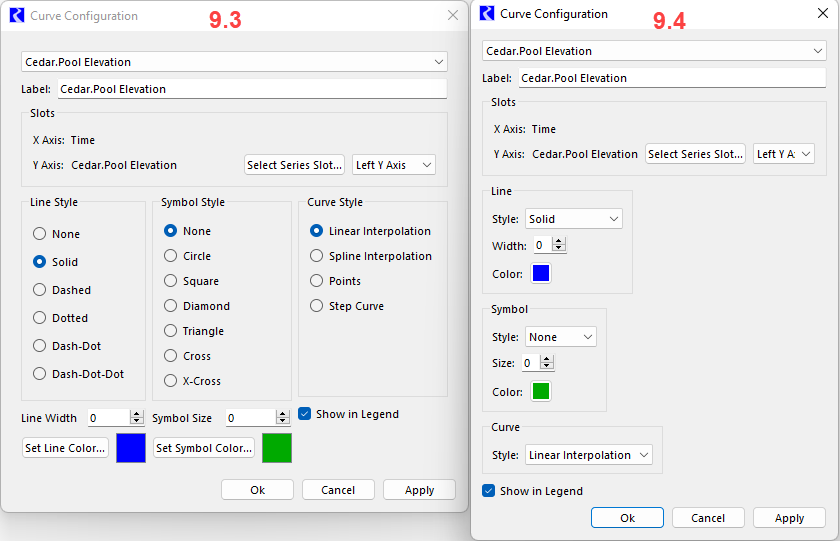
The Curve Configuration window has been redesigned to make better use of horizontal space. Rather than three columns, the new version has a single column with drop-down menus. All functionality and selections in the window remain the same. See Curve Configuration in Output Utilities and Data Visualization for more information.
Figure 1.13 Plot Curve Configuration comparison

Also see the note about related changes in the Settings Manager: Plot Default Curve Configuration.
Marker and Grid Configuration
Similar to the Curve Configuration window, the Marker Configuration and Grid Configuration windows have been redesigned to use drop down menus instead of radio buttons to make better use of horizontal space.
See Marker Configuration in Output Utilities and Data Visualization and Grid Configuration in Output Utilities and Data Visualization for more information.
Symbol Fill Color
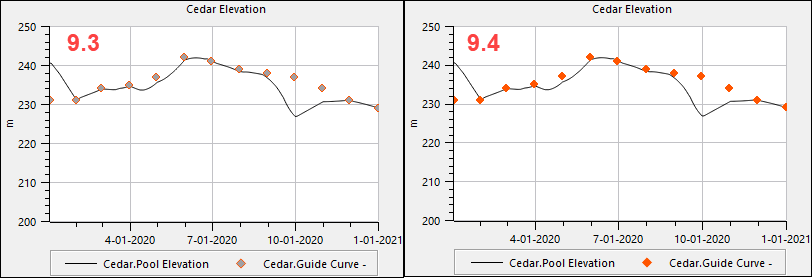
Previously symbols used on plots were only outlined in the selected color, and the fill was always gray. Now the selected color is used to fill the symbol. This addresses RW-7012. A screenshot is shown in Figure 1.14.
Figure 1.14 Plot Comparison of Marker colors

Revised: 01/10/2025