Ensemble Data Set Analysis
In this approach, you import RDF data, such as trace data created in an MRM, to create an ensemble Data Set and then perform various types of statistical analyses across traces.
Ensemble Data Analysis Tool Sequence
To use this approach you must have RDF output from an MRM run. An example Data Analysis Tool use-case is described by the following sequence. Remember that many of these steps can be automated using scripts as described in Script Actions for Working with Data Sets.
1. Run the model using concurrent MRM (Concurrent Runs in Solution Approaches) to produce an RDF output file (see Output Tab in Solution Approaches). This could be a regular or distributed run (seeDistributed Concurrent Runs in Solution Approaches).
2. Within the same model, open the DAT as described in Accessing the Data Analysis Tool.
3. Use the Import RDF button and select the RDF file. An Ensemble Data Set object is created on the workspace and shown in the tool.
4. If the Ensemble Data Set contains series data, use the Create Data Views button  to show over-plotted lines of all the traces for one or more slots.
 to show over-plotted lines of all the traces for one or more slots.
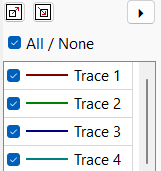
5. Use the legend/filter button  to see a legend of the traces and to filter the visibility of curves shown.
 to see a legend of the traces and to filter the visibility of curves shown.
6. To perform analysis, select the data set and select Analyze and select Analyze Selected Data Set.
7. Select the main category of analysis and then select any filtering options for slots or traces. Select the specific analysis type (mean, min, max, etc) along with any other relevant options. Select Perform Analysis when ready.
8. Based on the selections, the resulting data will be added to slots on new or existing Data Set objects. Open the objects from the DAT or the workspace and view or plot the data. In the future, additional plotting and visualization options may be available from the DAT.
9. If desired, use the “Visualize” button to create custom data views of the RDF data or the analysis results. Data Views with the following types can be added:
a. RDF Slot line curves on a plot
b. Analysis results curves and/or regions on a plot
10. If specified, the ensemble Data Set objects will be saved in the model file and can be accessed for additional analysis.
How to Use the Data Analysis Tool for Ensemble Analysis
The Data Analysis Tool allows you to create, view and analyze Ensemble Data Sets that are created from RDF files. This section describes these operations.
Tip: This only applies to ensemble data sets created from RDF files.
Creating Ensemble Data Sets
Use the Operations and then Import from RDF menu or use the Import RDF button. Then use the file chooser to select the RDF file and select Open. The Data Analysis Tool reads the RDF file and creates an Ensemble Data Set object on the workspace and shows it as an item in the Data Sets panel.
The default name and metadata is shown in the Data Sets panel and described below.
The Data Sets panel presents the list of data sets as an expandable tree view. Selecting a data set expands its row in the tree view.
For each ensemble data set, the following metadata and properties are shown in the list:
• Save With Model: Whether the ensemble data set should be saved in the model as an object or is temporary and will not be saved
• RDF File Path: the path of the RDF file from which the data set was created
• RDF File Creation Time: The date and time at which the RDF file was created
• RDF Number of Timesteps: Count of the number of timesteps for series slots in the RDF file
• RDF Start Date: earliest date/time of series data in the RDF file
• RDF End Date: latest date/time of series data in the RDF file
• RDF Timestep size: the size of the timestep for series data.
• RDF Number of Runs: count of the runs in the RDF file
• RDF Trace Range: the range of trace numbers for traces in the RDF file
• Number of Data Set Slots: the number of slots in the data set found by multiplying the number of slots by the number of traces.
• RDF Slots: An expandable list of all of the slots in the set. With this expanded, select one slot and create a Data View or Plot Page using the buttons or right-click context menus.
Information on analysis Data Set properties is in Viewing Data Set properties
Analyzing Data Sets
Use the Analyze button to perform analysis on an ensemble Data Set. Currently, only ensemble data sets from RDF files can be analyzed; in the future there may be ways to perform additional computations on analysis Data Sets.
The following types of analysis actions are supported by the Data Analysis Tool. These correspond directly to the types of analysis supported by the ensemble data analysis script action types. See the script documentation for the specific details of each analysis type.
Table 7.1 Ensemble Analysis Actions
Analysis Action (data type) | Link to Script Information |
|---|---|
Analyze Ensemble Data Set (per timestep, across traces) | |
Compute Scalar Regression (on scalar data, across Traces) | |
Compute Duration Curve (on series data, across Traces) |
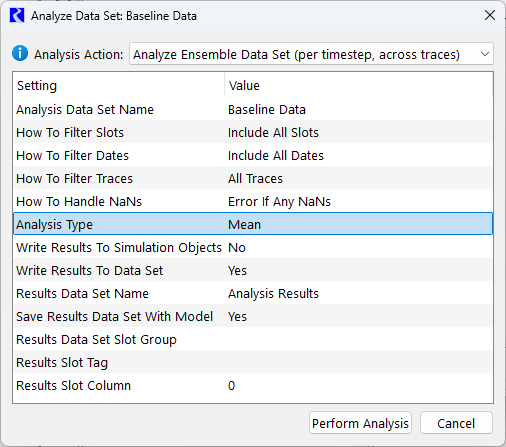
When you select Analyze and then Analyze Selected Data Set, the tool presents a modal dialog that allows you to configure and perform the analysis as shown in Figure 7.3
Figure 7.3 Screenshot of Analyze Data Set dialog

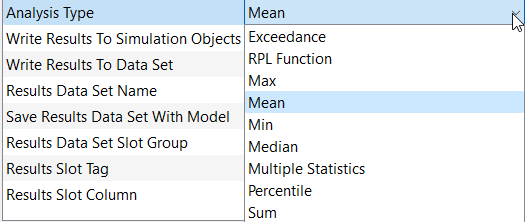
Select any item in the right column to initiate editing. For example, select the Mean value and then select from the menu to change the analysis type, as shown in Figure 7.4. Documentation of the various options are in the script documentation, with links in the table above, Analyzing Data Sets.
Figure 7.4 Screenshot of editing while using the Analyze Data Set dialog

Warning: Ensemble data analysis is not supported for aggregate series slots. Including aggregate series slots in ensemble data analysis will result in an error.
Visualizing Data Sets
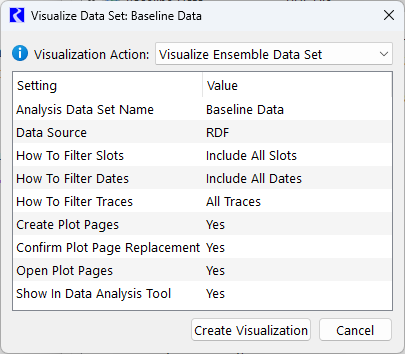
Use the Visualize button to create plots as Data Views in the DAT and/or Plot Pages. The tool presents a modal dialog that allows you to configure the visualization, as shown in Figure 7.5
Figure 7.5 Screenshot of Visualize Ensemble Data Set dialog

First select from the menu the type of visualization you’d like to perform. Then select any item in the right column to initiate editing. For example, select the “All Traces” value and then select from the menu to change which traces to show, as shown in Figure 7.6. Documentation of the various options are in the script documentation, Visualize Ensemble Data Set in Automation Tools.
Figure 7.6 Screenshot of editing while using the Visualize Ensemble Data Set dialog

Once satisfied, select Create Visualization and the specified Data Views and/or Plot Pages will be created.
Revised: 01/10/2025