
Outputs and Plotting
The following changes were made to Outputs and Plotting.
Data Analysis - Multiple Percentiles and Exceedances
In the Data Analysis Tool, a new analysis type, Multiple Exceedances, was added for the Analyze Ensemble Data Set analysis action. Also, the analysis type previously called Multiple Statistics was changed to Multiple Percentiles. More information about these changes is provided in the description of the related script action: Analyze Ensemble Data Set Enhancements
Figure 1.9 Analyze Ensemble Data Set settings showing new Multiple Exceedances analysis type
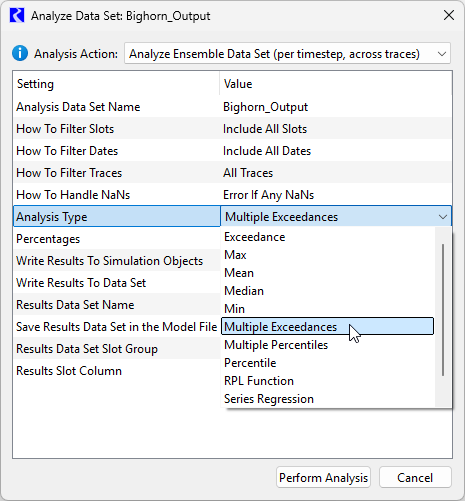
See Ensemble Data Set Analysis in Output Utilities and Data Visualization for more information.
Data Analysis Tool Curve Configurations for Data Views
The following changes were made to curve configurations for data views shown in the Data Analysis Tool.
• All aspects of the Plotting Default Curve Configuration settings in the Settings Manager are now used to determine the curve configuration. This includes color, line style, width, symbol, and curve style. Previously only the colors from the Default Curve Configuration settings were used.
Figure 1.10 Settings Manager showing Default Curve Configurations for plots, which are now used for Data Analysis Tool data views.
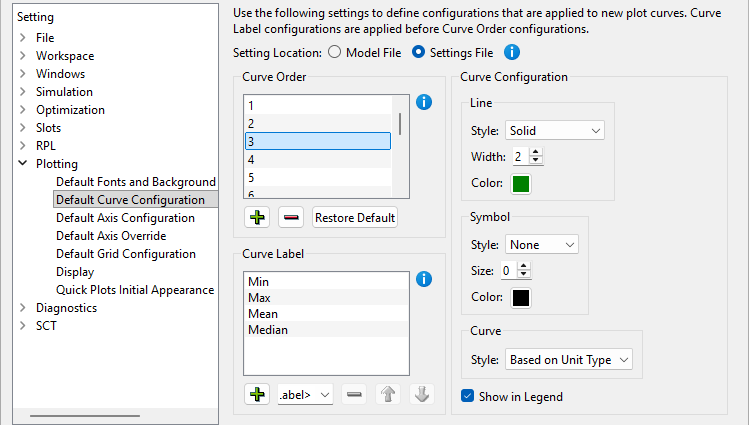
See Configuration Defaults in Output Utilities and Data Visualization for more information on Plotting Defaults Configuration.
• Once a configuration has been used in a data view for a curve with a given label (typically a trace number), all other data view curves with that label are displayed with the same configuration. In other words, the same configuration will be used for a given trace across all data views.
• The configuration of curves and shading between curves for visualizations of Multiple Percentiles (formerly Multiple Statistics) and Multiple Exceedances analysis outputs was modified slightly to support user-specified percentages in the analysis. With this change, the data views that are similar to, but not identical to those generated by previous versions for Multiple Statistics. The following describes the configuration.
– Except for color, all curves share the same configuration, the “factory default” curve configuration (solid line, two pixels line width, no symbols, style based on unit type).
– The colors are selected from a rainbow color map, with the percentage value associated with a curve used as the index into the color map.
Figure 1.11 Data View of Multiple Percentiles using custom percentiles
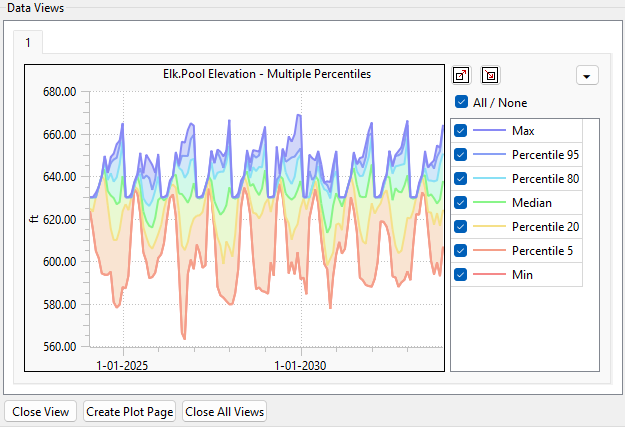
See Data Views - Plots of Data Sets Series Slots in Output Utilities and Data Visualization for more information on visualizing data in the Data Analysis Tool.
Revised: 11/12/2026