
Scripts
The following changes have been made to RiverWare scripts.
Analyze Ensemble Data Set Enhancements
The following enhancements were made to the Analyze Ensemble Data Set script action.
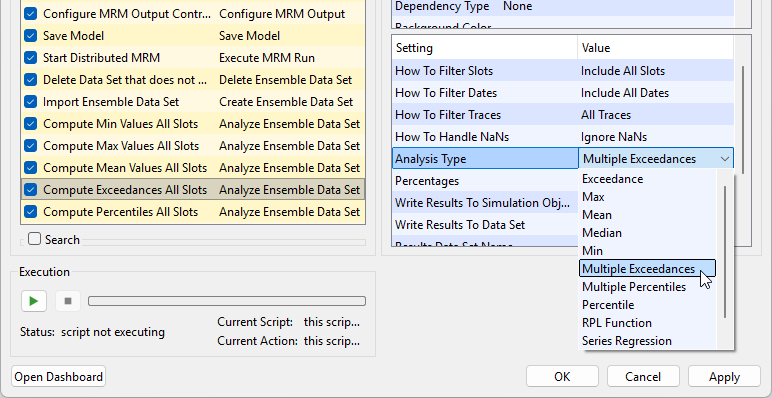
• Multiple Exceedances: A new Analysis Type was added, Multiple Exceedances. The exceedance is the inverse of the percentile. In other words, the exceedance percentage is 100% minus the percentile, or the value that is exceeded by the specified percent of trace values in the ensemble. As with the other analysis types for the Analyze Ensemble Data Set action, Multiple Exceedances computes the statistics at each timestep across all selected traces in the ensemble outputs for the specified slots.
Figure 1.15 Script Editor showing the new Multiple Exceedances Analysis Type for the Analyze Ensemble Data Set action
• Multiple Percentiles: The Analysis Type previously called “Multiple Statistics” has been renamed to “Multiple Percentiles” to distinguish it from the new Multiple Exceedances analysis type. The behavior remains the same, and existing models will automatically update without any changes required by the user.
• Percentages Setting: The Multiple Exceedances and Multiple Percentiles analysis types now have a new Percentages setting that allows you to specify the percentages used for the analysis. Previously the percentages were hard-coded to 0, 10, 25, 50, 75, 90, and 100. Those previously hard-coded percentages are still used as the defaults so that existing models that used the Multiple Statistics (now Multiple Percentiles) analysis type will maintain the same behavior.
Figure 1.16 Script Editor showing the new Percentages setting for the Analyze Ensemble Data Set action when Multiple Percentiles is selected as the Analysis Type
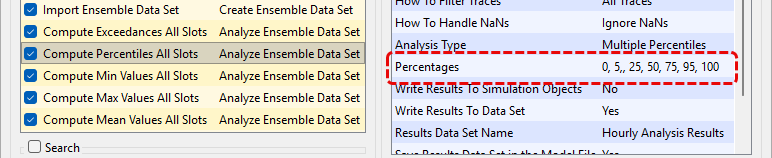
Note: The percentage of 0 is interpreted as the maximum value for Multiple Exceedances and the minimum value for Multiple Percentiles. Conversely the percentage of 100 is interpreted as the minimum value for Multiple Exceedances and maximum value for Multiple Percentiles.
• In the Analysis Type setting menu, the options are now listed in alphabetical order for easier selection. (See Figure 1.15)
See Analyze Ensemble Data Set in Automation Tools for more information on this script action.
See the related note about visualization of Multiple Percentiles and Multiple Exceedances outputs: Data Analysis Tool Curve Configurations for Data Views.
Revised: 11/12/2026