
Slots
The following changes have been made to RiverWare slots.
Export Copy
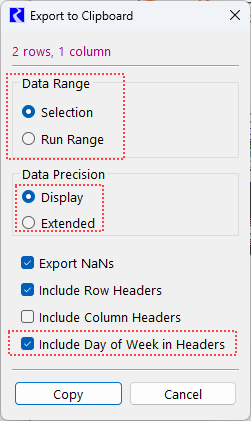
The export copy operation exports values by copying them to the system clipboard. The following options were added or modified in the Export Copy window:
• Selection regarding what to export for time series. The options are:
– Selection. Only the selected cells will be exported.
– Run Range. For series data, this can either contract or expand the exported timesteps.
• The terminology of the data precision was changed to
– Extended: Previously called “Model”, it exports with extended precision, up to 15 digits.
– Display: Export exactly as shown.
• A new Include Day of Week in Headers checkbox. Previously, the day of the week was always included and this was not recognized when pasting to Excel. Exporting dates without the day of the week leads to actual dates when pasted to Excel.
Figure 1.12 shows these three new options.
See Export Copy in User Interface for more information.
Figure 1.12 Export to Clipboard window shown with modified options
Find Slot References can locate slots in SCT color alerts
The Find Slot References window is now able to locate slots that have been specified as reference slots or threshold values in SCT color alerts. Slots found in color alerts display which primary SCT slot affected the color alerts.
Series Slot Notes User Name
Series slot notes allow you to include annotations or comments on series slot values. Notes now track the name of the user that created them. See Note Instances Panel in User Interface. When exporting or importing these notes with a Control File-Executable DMI, the username is also exported or imported.
Statistical Table Slots
Statistical Table Slots compute one or more statistics of another slot. The following changes were made to Statistical Table Slots.
Plotting Position Settings
A new Exceedance Calculation setting was added to statistical table slots that allow you to specify how the percentage exceedance is calculated for the relevant statistical functions. Options include the following:
• Interpolated (existing)
• Weibull
• Hazen
• Median
See Exceedence Calculations in User Interface for more information.
Log-Pearson Type III Distribution Statistical Function
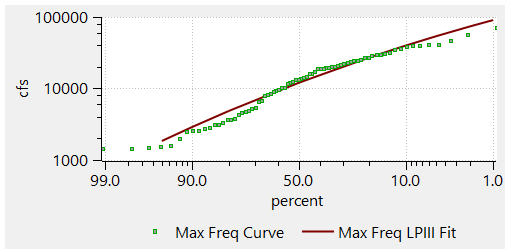
A new statistical function was added that fits an existing frequency curve (computed by a statistical table slot) using a Log-Pearson Type III Distribution. Plotting the results of the analysis places both the input frequency curve and the Log-Pearson Type III Distribution data onto the same plot. A plot is shown below.
Figure 1.13 Plot showing a Log-Pearson Type III distribution and its source slto
For more information, see Log-Pearson Type III Distribution in User Interface..
Revised: 07/03/2024