
Output Types
The following outputs can be generated by RiverWare:
• Plot Page
• RiverWare Data File (.rdf); see RiverWare Data Format (RDF) for details.
• Comma-Delimited File (.cdf)
• Comma-separated Values File (.csv)
• Excel spreadsheet
• Tabular Series Slot Report (text or html)
• Model Report
• Chart
• Output Canvas
Plot Page
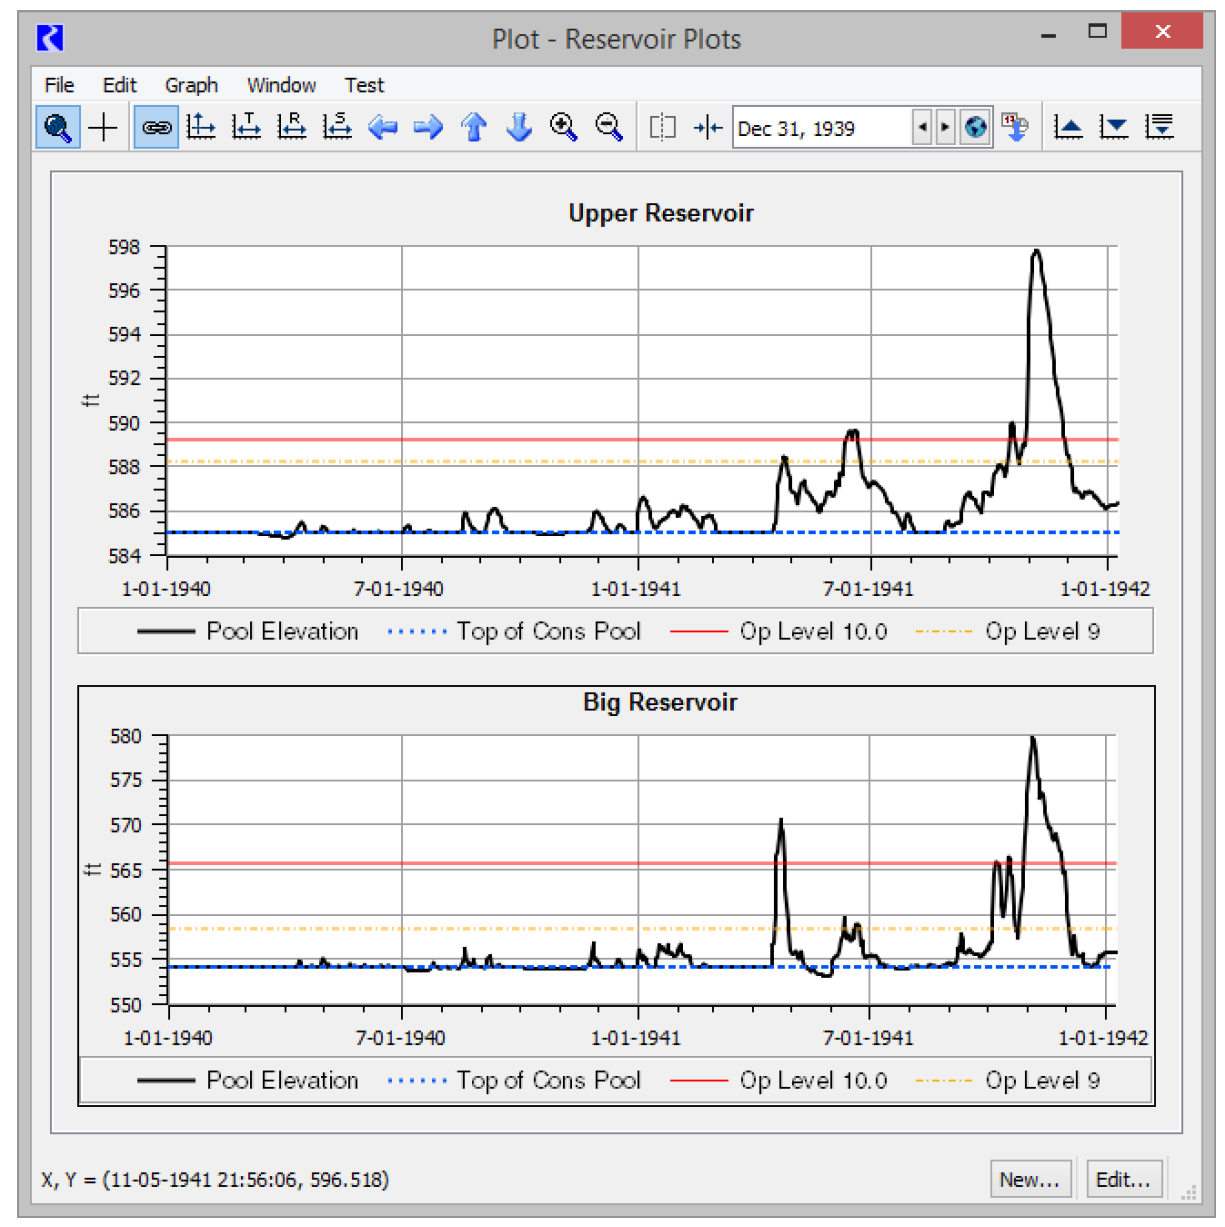
The Plot Page output device allows you to plot data. Figure 1.1 is a sample. See Plotting for additional information.
Figure 1.1 Sample 2X1 plot page
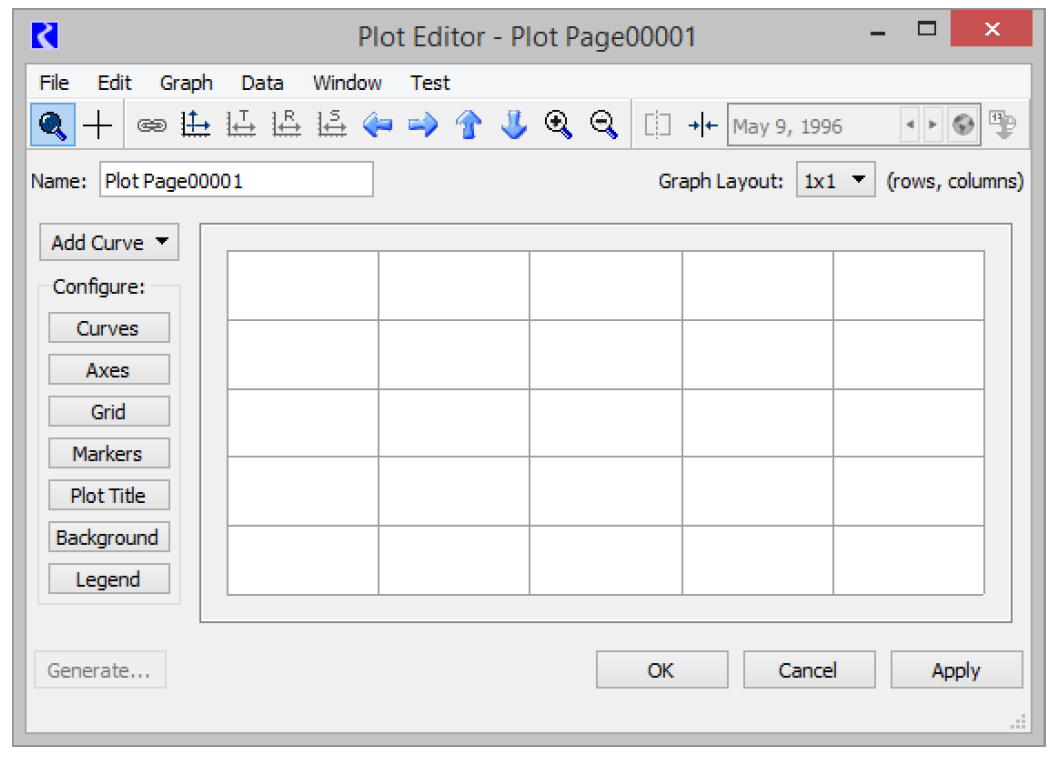
Creating a New Plot Page
To create a new plot page, select New, then New Plot Page from the Output Manager dialog. A blank Plot Page Editor dialog appears. See Plot Page Editor for details on adding curves and configuring plots.
Creating RDF and CDF data files
The steps for generating RDF and CDF files are similar, so we will explore creating only the RiverWare Data File. To create a Comma-Delimited File (one line per slot), use the following steps and generate a .cdf file instead of a .rdf file.
1. In the Output Manager select New, then New Riverware Data File from the menu bar at the top of the dialog. A new Riverware Data File: window appears with the name Riverware Data File: Riverware Data File00001. Notice that in the Output Type: selector the RiverWare Data Format File is chosen.
2. Select the appropriate slots
3. In the Output File: field type a path and file name. These files should end in .rdf as the .rdf extension is for RiverWare Data File.
4. Select Save. The output device window closes and its name turns black in the Output Manager.
5. In the Output Manager dialog, select the device then select Generate. A new output file has been created in the specified directory.
Use the Slots menu to show slots in an SCT. The Slots, then SCT, then More selections are available for these Output Devices. These two operations show the items selected within the Output Device’s slot list in an SCT, either in a new SCT or in the single open SCT. The latter operation is available only if exactly one open SCT is visible (not minimized
Creating a Comma-separated Values File
Following are the steps to create a Comma-separated Values (CSV) file. The CSV file has one line per timestep and includes many other fields, some automatically and some optionally. This CSV format is designed to be used in Excel or the Tableau software.
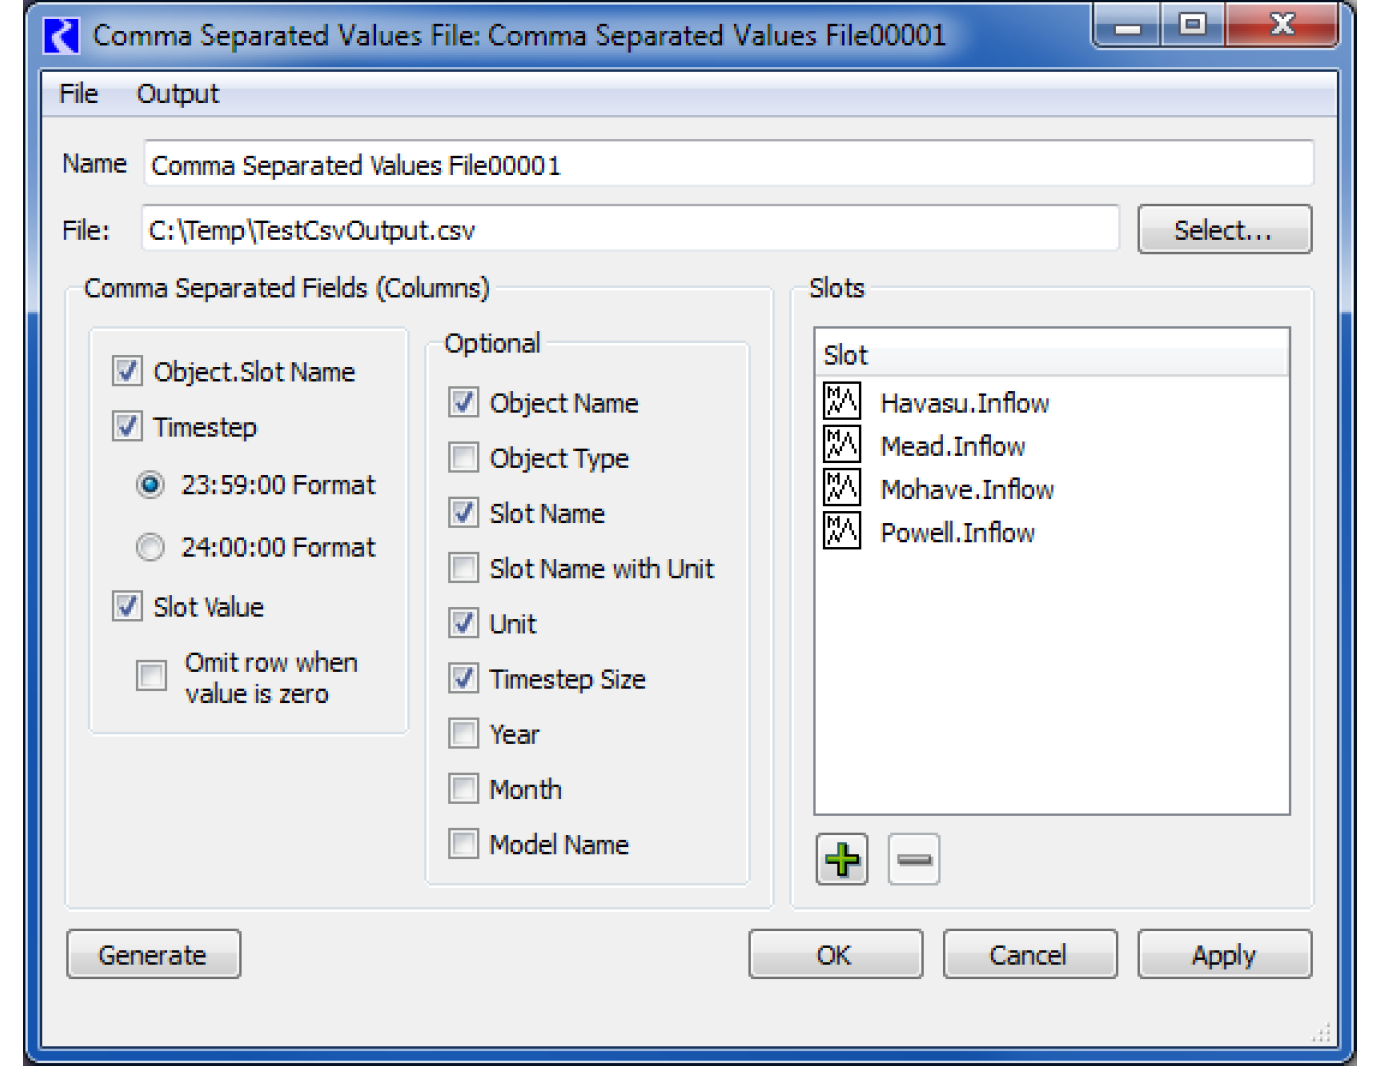
1. In the Output Manager select New, then New Comma-Separated Values File from the menu bar at the top of the dialog.
A new Comma Separated Values File window appears with the name Comma Separated Values File00001. The fields in the left list always remain checked for output as columns to the file.
2. Select a timestep option for the format of the written time. RiverWare uses end of timestep format for all datetime references. Thus for a 1 Month timestep, July 2014 would be fully specified as 7/31/2014 24:00. Tableau and Excel do not have a concept of 24:00 as a time but would instead use 8/1/2014 00:00 for the same point in time. Therefore with the proper timestep option selected in the dialog, one minute is subtracted from all timestep values (e.g. 7/31/2014 23:59) to assure that they appear with the appropriate day and month references in Excel and Tableau.
3. If desired, check the option to Omit rows when value is zero. When selected, rows are not written to the output file when the slot’s value for that row is zero. The value is considered zero, in this case, if the absolute value is less than 1 x 10⁻⁸.
4. Check any of the Optional fields for output as additional columns in the file.
5. Select the desired slots for output by selecting +.
6. In the File: field type a path and file name or select a file. The file should end in .csv to indicate a comma-separated values file.
7. Select OK.
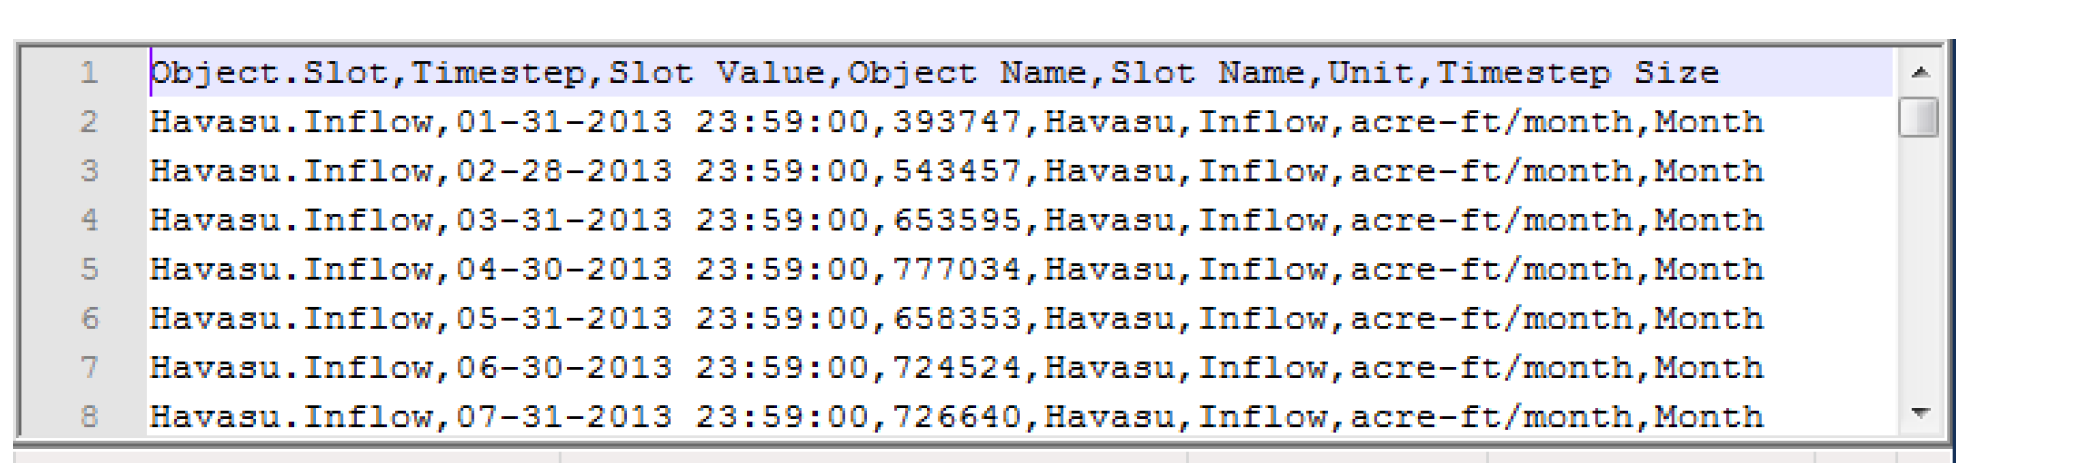
8. In the Output Manager dialog, select the device then select Generate. A new output file is created in the specified directory. Figure 1.2 shows an example format.
Figure 1.2
Creating an Excel Spreadsheet
Following are the steps to create an Excel spreadsheet.
1. In the Output Manager select New, then New Excel File from the menu bar at the top of the dialog.
A new Excel File: window appears with the name Excel File00001. In the Output Type: selector the Excel File is chosen.
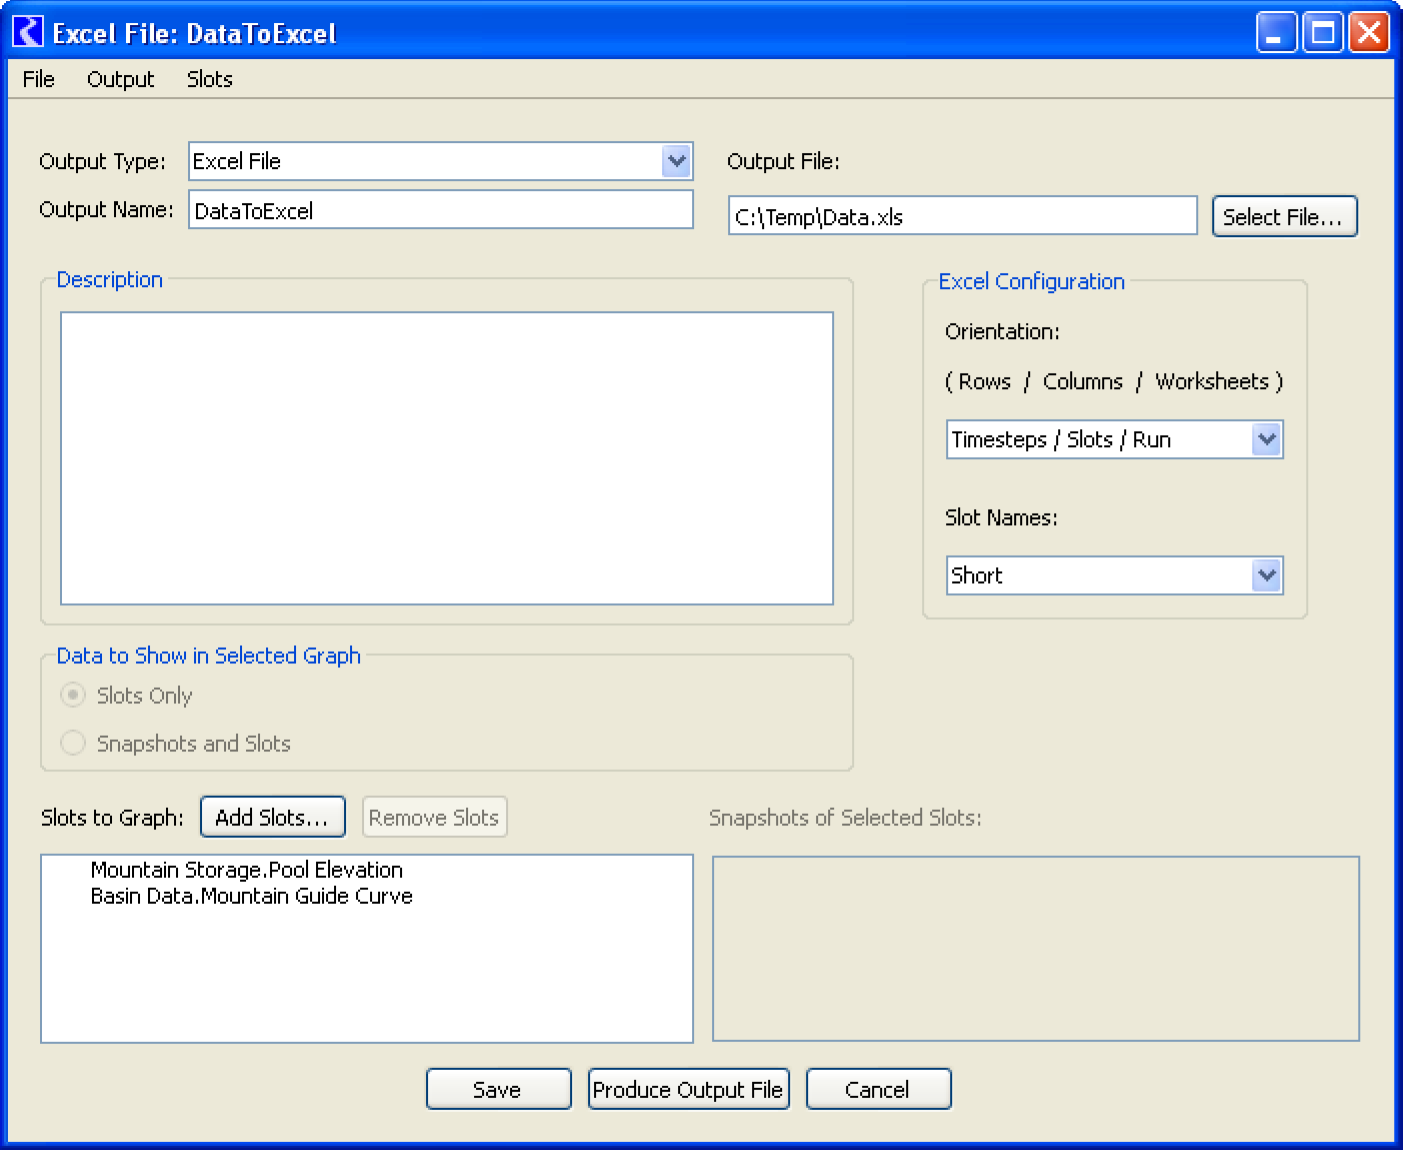
2. Select the appropriate slots.
3. In the Output File: field type a path and file name or select a file. These files should end in .xls or .xlsx to indicate it is an Excel spreadsheet.
4. Select from the Orientation drop-down box. This configures how slots, timesteps, and runs are translated into rows, columns, and worksheets in Excel.
5. Select from the Slot Names drop-down box. This configures how slot names are written into the Excel data sheets. Options are as full names, automatically shortened names (lower case vowels removed), or index names (Slot0, Slot1, etc.).
6. Select Save. The output device window closes and its name turns black in the Output Manager.
7. In the Output Manager dialog highlight the new device, select Generate. A new output file has been created in the specified directory.
Creating a Tabular Series Slot Report
A Tabular Series Slot Report is an output device which generates a plain text or HTML document showing, in a table or multiple tables, series values for a set of slots. See Tabular Series Slot Report for details.
New report configurations are created within the Output Manager dialog. Use the following steps to create a new report.
1. In the Output Manager select New, then New Tabular Series Slot Report from the menu bar at the top of the dialog.
A new Tabular Series Slot Report: window appears with the name Slot Report00001.
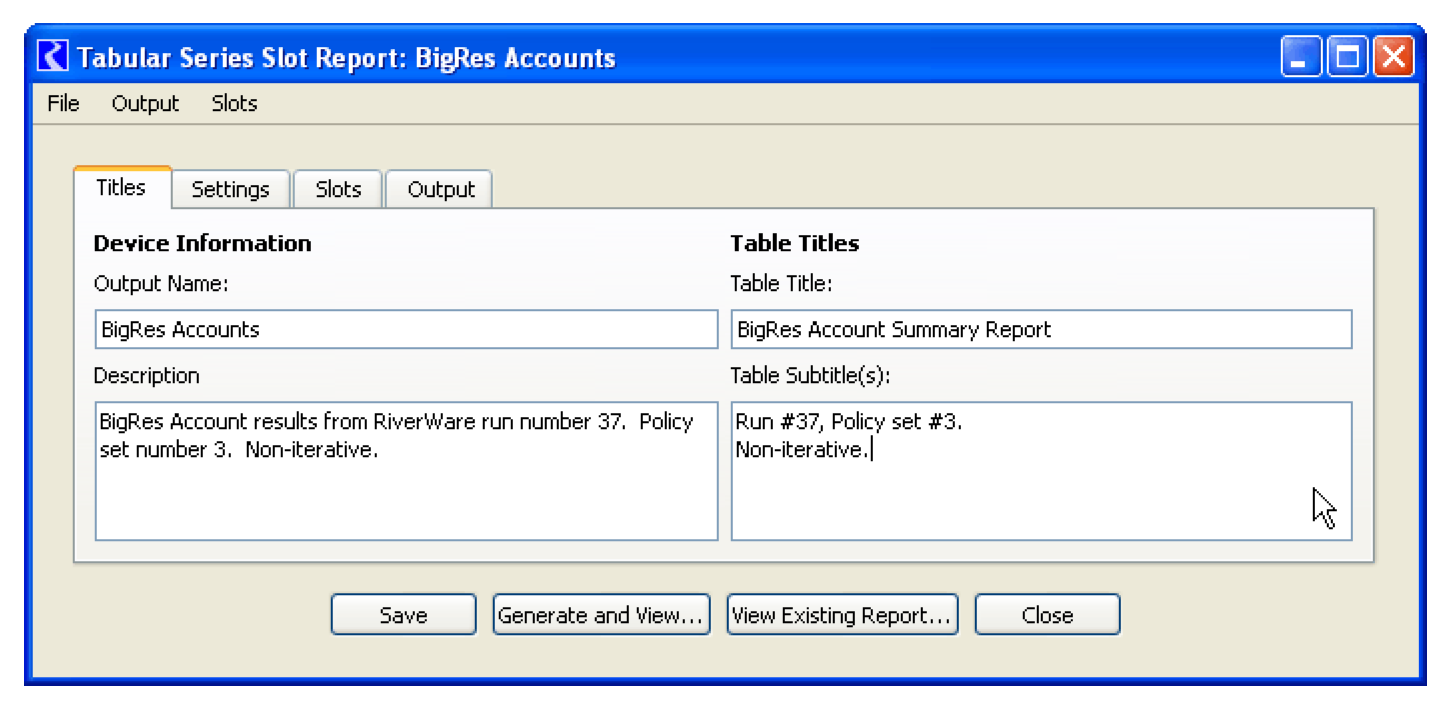
2. Configure the new report using the dialog. See Configuring Tabular Series Slot Reports for details.
3. Once configured, select Save (The output device window closes and its name turns black in the Output Manager) or select Generate and View to see the resulting file.
4. Alternatively, to generate and view the report, from the Output Manager dialog, highlight the new device, select Generate.
See Tabular Series Slot Report for additional information.
Creating a Model Report
A Model Report is an output device which generates an HTML document showing information about a model including slots, selected methods, run range, and subbasin membership. See Model Report for details.
New report configurations are created within the Output Manager dialog. Use the following steps to create a new report in the Output Manager.
1. Select New, then New Model Report from the menu bar at the top of the dialog.
A new Model Report: window appears.
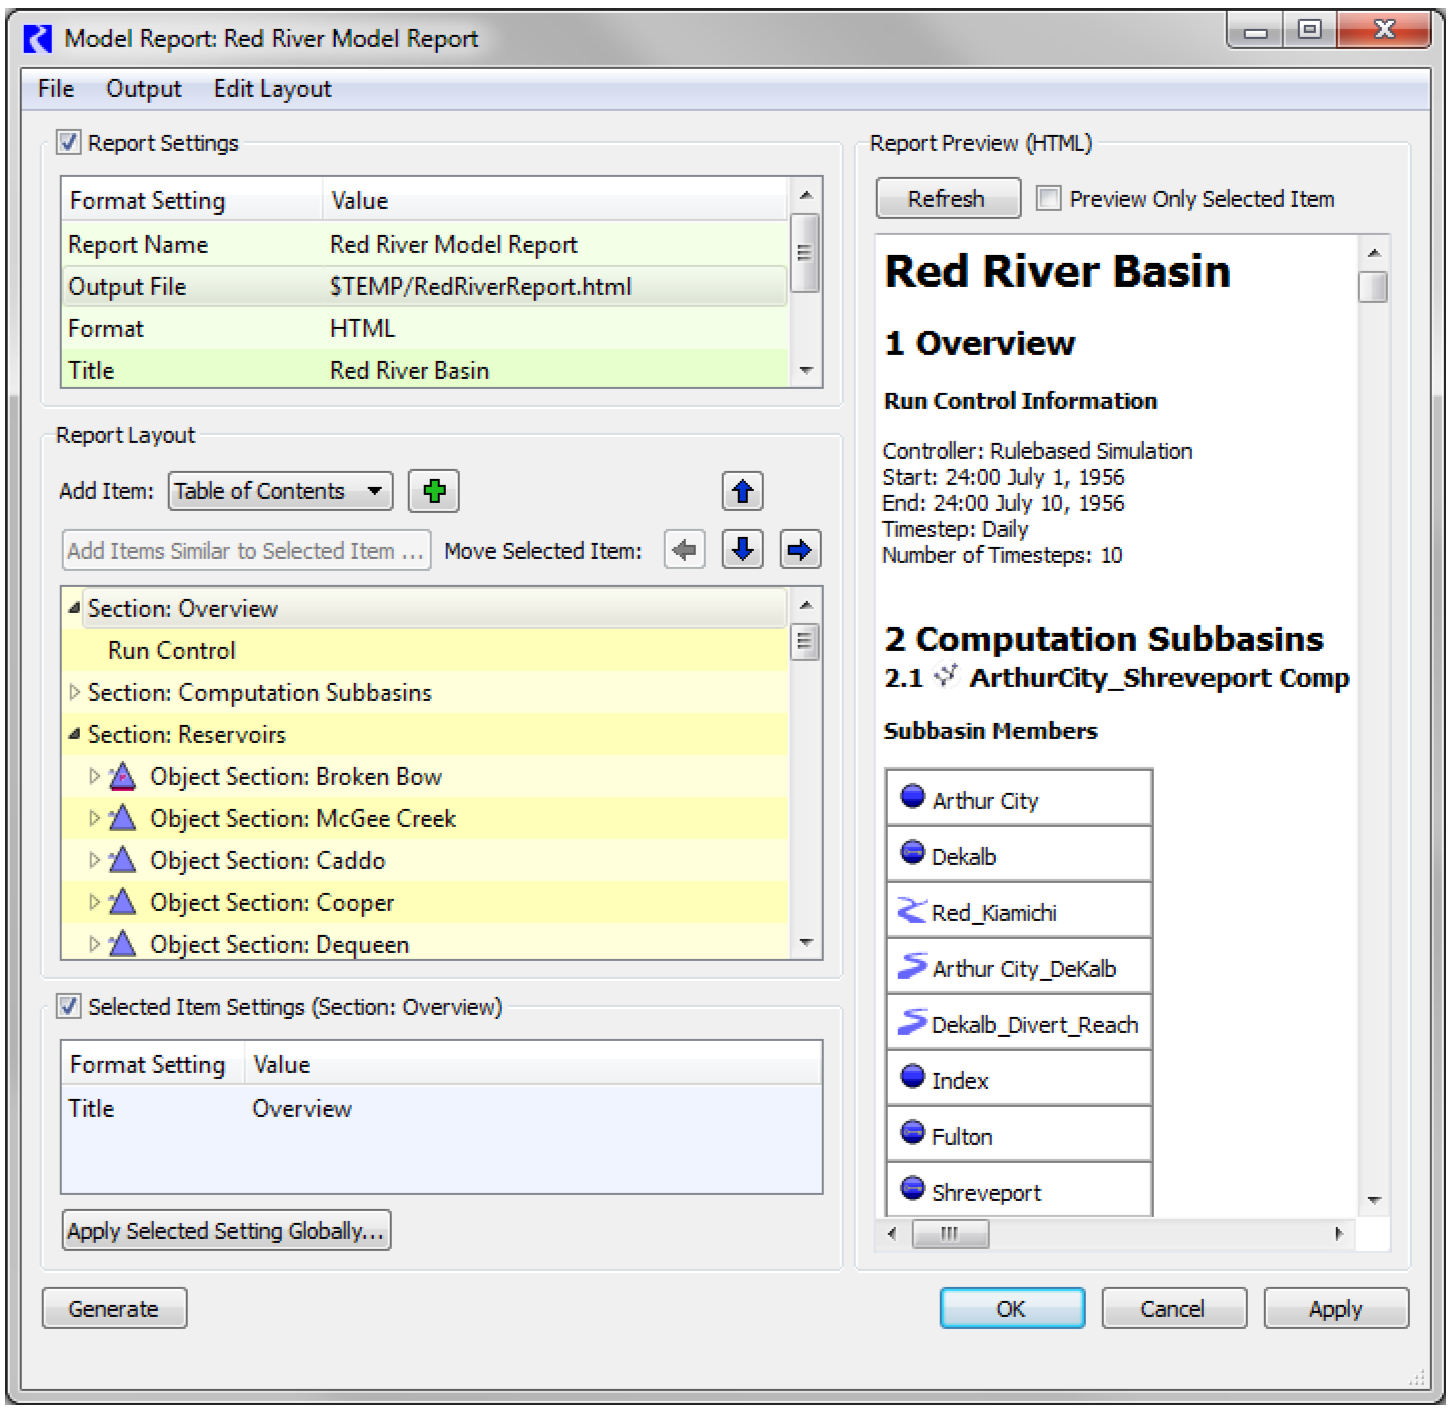
2. Configure the new report using the dialog. See Configuring Model Reports for details.
3. Once configured, select Ok. The output device window closes and its name turns black in the Output Manager.
4. Alternatively, to generate and view the report, from the Output Manager dialog, highlight the new device, select Generate.
See Model Report for additional information.
Creating a Chart
A Chart is an output device which generates a pie chart of data from specified slots. See Chart for details.
New chart configurations are created within the Output Manager dialog. Use the following steps to create a new chart.
1. In the Output Manager select New, then New Chart from the menu bar at the top of the dialog.
A new Chart: window appears with the name Chart00001.
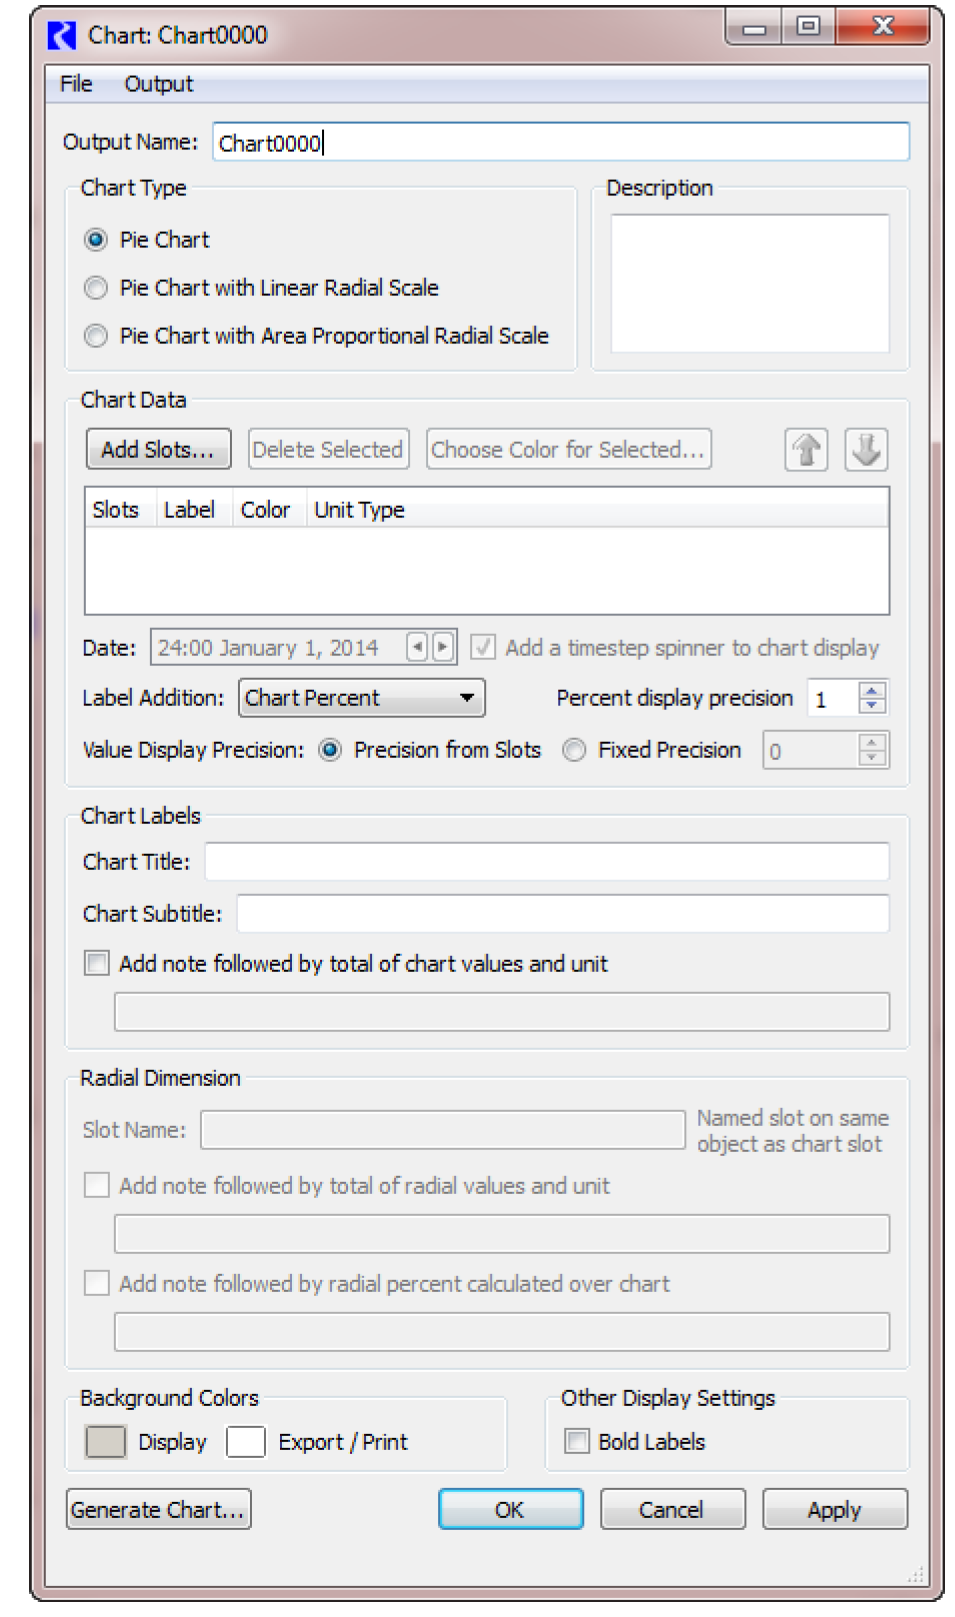
2. Configure the new chart using the dialog. See Configuring Charts for details.
3. Once configured, select Ok (The output device window closes and its name turns black in the Output Manager) or select Generate Chart to see the resulting chart.
4. Alternatively, to generate and view the chart, from the Output Manager dialog, highlight the new device, select Generate.
See Chart for additional information.
Creating an Output Canvas
An Output Canvas is an output device which generates Teacup diagrams and other data visualization utilities. See Output Canvas for details.
New Output Canvas configurations are created within the Output Manager dialog. Use the following steps to create a new Output Canvas.
1. In the Output Manager select New, then New Output Canvas from the menu bar at the top of the dialog.
A new Output Canvas window appears.
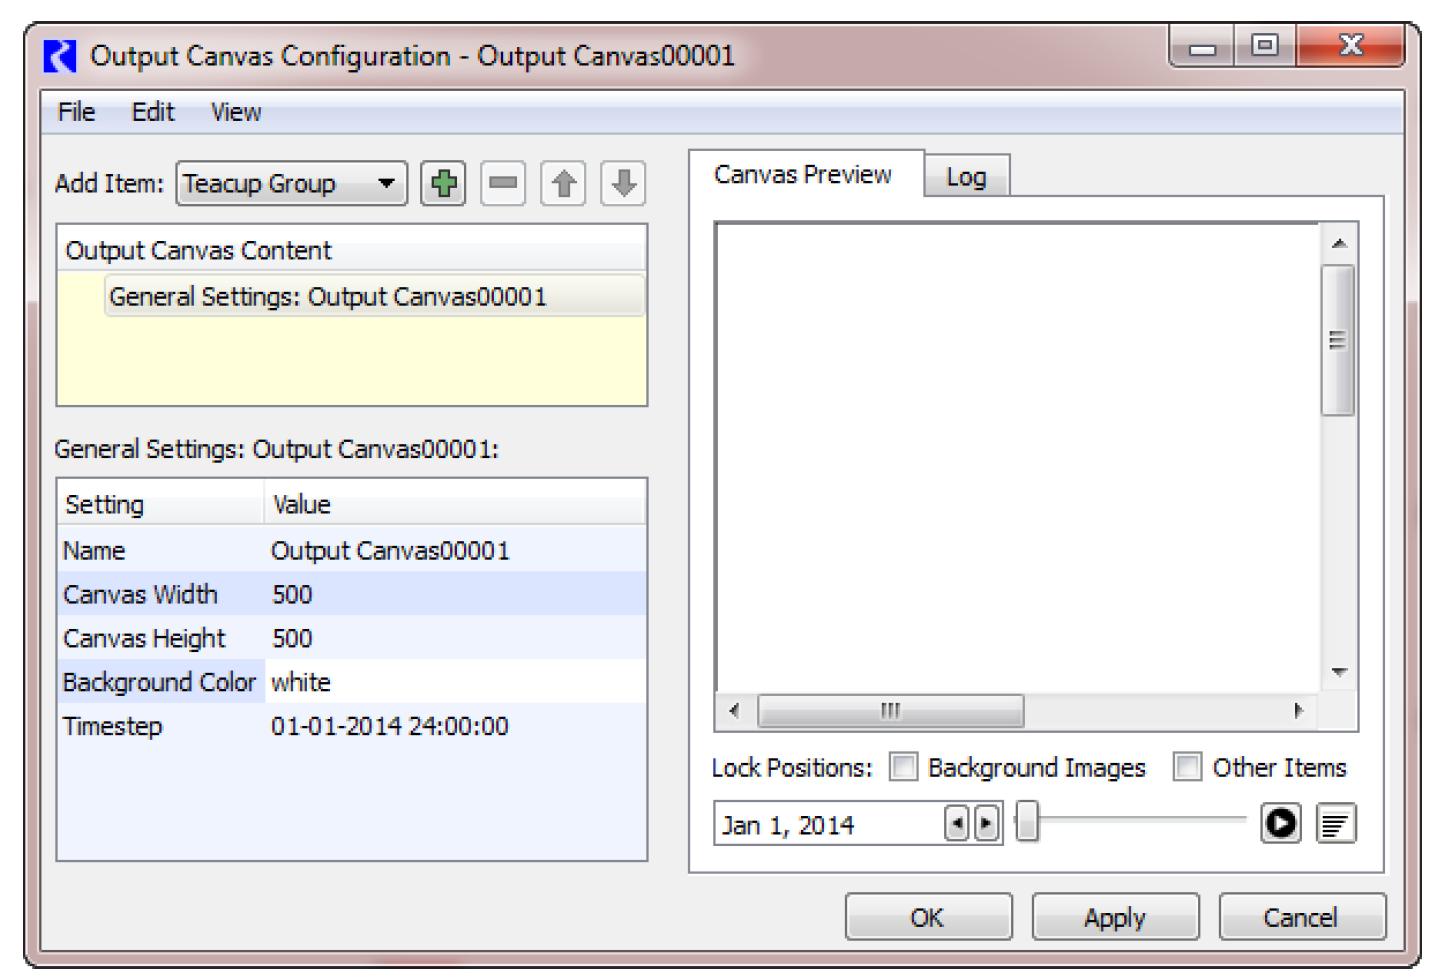
2. Configure the new canvas using the dialog. See Configuring an Output Canvas for details.
3. Once configured, select Ok (The output device window closes and its name turns black in the Output Manager).
4. Alternatively, to generate and view the canvas, from the Output Manager dialog, highlight the new device, select Generate.
See Output Canvas for additional information.
Revised: 08/04/2020