About RiverWare Diagnostics
Diagnostics are a powerful and helpful feature which provide you with the ability to gather useful messages during the course of a run or while building a model. User-selected diagnostic messages are displayed in the Diagnostics Output Window where Error and Warning messages also appear. Diagnostics may be filtered according to their context or turned off altogether. Errors and Warnings may not. Unlike Errors or Warnings, the Diagnostics Output Window will not be forced to the front by diagnostics. It is up to you to open the window.
Diagnostics Process Overview
Following is a quick guide to using diagnostics.
3. Select the diagnostic categories you wish to print. See Diagnostic Configuration Dialogs.
4. Filter the diagnostics by Object, Slot, Timestep, Rule, or Account. See Context Filtering.
5. Apply the changes in both the Diagnostic Configuration dialog and the Diagnostics Manager dialogs.
6. Run the model and view the diagnostics in the specified file or Diagnostics Output. See Diagnostic Output Window.
See RPL Debugging and Analysis for details on debugging RPL logic using diagnostics or other tools.
Diagnostics Manager
The Diagnostics Manager is used to enable informational diagnostics. Informational diagnostics are any messages which, although helpful in debugging, are not indicators of problems which would stop a modeling run. Informational diagnostics should not be confused with RiverWare warnings and errors. Whereas informational diagnostics may be filtered by context and turned off altogether, warnings and errors may not. Warnings and errors are always displayed in the Diagnostics Output window, and errors always force this window to come to the front of other open windows.
The diagnostics Manager can be accessed as follows:
• From the main workspace, select Utilities, then Diagnostics Manager...
• From the Run Control dialog, select View, then Diagnostics Manager...
• From the Diagnostics Output Window, select Settings, then Diagnostics Manager...
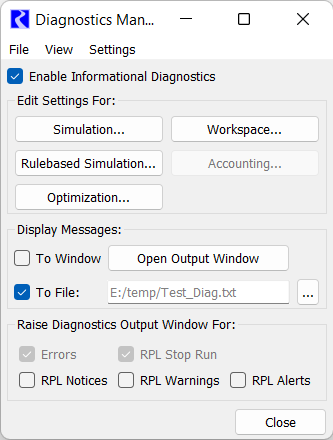
RiverWare is initially started with the diagnostic capability disabled primarily for efficiency. Posting, filtering, and outputting unnecessary diagnostic messages may take up a significant portion of the run time. This should be kept in mind when activating diagnostic categories and filters. An excessive amount of diagnostic messages produced at run time may considerably slow down the execution.
Enable Informational Diagnostics
Use the following steps to enable informational diagnostics.
1. Enable informational diagnostics. Select the Enable Informational Diagnostics checkbox. Do this only if the checkbox is not already checked.
2. Specify diagnostic destination. The destination of output messages is set by selecting the To Window and/or To File checkboxes.
– The To Window option is selected by default.
– In the case of file output, the file name and path must also be specified by selecting the button:

Then in the text field or through the file chooser, specify the file.
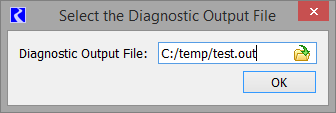
Note: Changes to the diagnostics manager happen as items are changed. Prior to RiverWare Version 8.3, you had to Apply or Ok changes.
Diagnostics are divided into categories which appear in the upper portion of the Diagnostics Manager. Each category is a button which opens up the Diagnostics Configuration dialog for that category:
The first three categories are associated with the controllers of the same name. Accounting diagnostics are enabled only if the Accounting is enabled. For Simulation and Rulebased Simulation, diagnostic messages are generated and filtered during a run according to the settings specified for the currently active controller only. The Workspace category, however, is independent of the current controller. It is active before and after a model run. For example, diagnostics for expression slots that are configured to execute at the end of a timestep must be set up in either the Simulation or Rulebased Simulation category. Diagnostics for expression slots that are evaluated manually must be configured from the Workspace category.
Raise Diagnostics Output Window
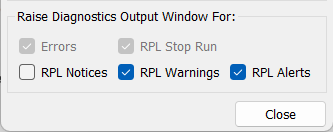
The Diagnostics Output Window will always open and come to the front whenever an error message is posted. This includes messages from RPL Stop Run statements and expressions, which are handled as error messages. The Diagnostics Manager also provides the option to automatically open the Diagnostics Output Window and bring it to the front for messages posted from RPL Notice, RPL Warning, and RPL Alert statements and expressions (see RPL Statements in RiverWare Policy Language (RPL) for information on these statement types). Select the checkbox for each statement type if you want it to automatically raise the Diagnostics Output Window. The default is that these items are not selected, and thus, these messages will not automatically raise the Diagnostics Output Window.
Loading and Saving Diagnostic Configurations
Once you have configured the diagnostics settings, these settings can be saved to a file and loaded at a later time. This allows you to configure and save various combinations of diagnostics configurations and context filters. Settings are loaded and saved by selecting File, then Load Settings or File, then Save Settings in the Diagnostics Manager dialog.
Diagnostic Configuration Dialogs
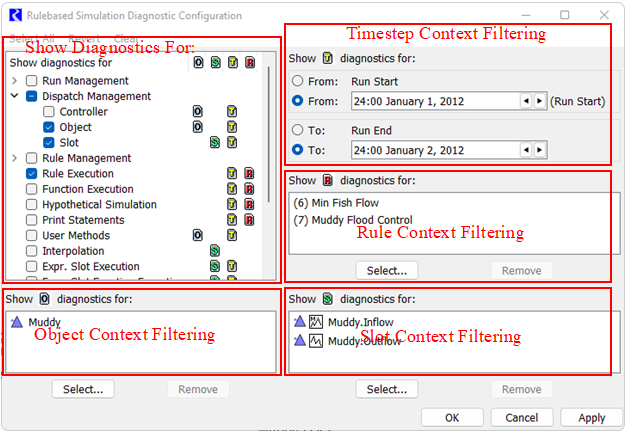
Each of the diagnostics configuration dialogs contains a group of diagnostics to enable or disable, and a set of context filters. The available groups are shown below the title “Show diagnostics for” in the upper left section of the dialog window. Each of these diagnostics groups can be toggled on or off by selecting the checkbox located to the left of the group name. Multiple groups can be turned on at once. Some diagnostics groups are only visible by toggling a tree view triangle.
The mechanism which allows you to narrow down the number of diagnostics that will appear is called context. The various contexts are: object, slot, timestep, and rule. Not all of these contexts are valid for every configurations dialog. For example, generating diagnostics about the dispatching of objects is independent of any Slot context. The Simulation Diagnostics Configuration dialog only allows filtering of messages by Object, Slot, and/or Timestep. Selecting a limited set of a particular context, restricts diagnostic generation to that set. For instance, the <ALL OBJECTS> value within the Show O diagnostics for field means that object-related diagnostics will be generated for every object that exists on the RiverWare workspace. If, however, a limited set of objects is listed within the field, then object-related diagnostics will only be generated for that select set of objects.
For any average size model, enabling this many diagnostics is dangerous. The time spent posting, processing, and displaying diagnostic messages may “freeze” model execution. For a small model, the effect is limited to a noticeable slowdown. In general, diagnostics should never be enabled without considerable context filtering. See Context Filtering for proper use of context filtering.
Following is a description of the Diagnostics Groups and the Context filtering available in the Diagnostics Manager.
Diagnostics Groups
A diagnostics group is a category of diagnostic messages that pertain to similar events within a run. They include such things as object dispatching information, rules firing information, rules agenda information, slot value information, etc. A complete list of the types of messages issued by each diagnostics group is presented in subsequent sections.
Figure 3.1 shows the Diagnostic Configuration dialog. Diagnostics groups are selected in the upper left portion of the dialog, in the window below the “Show diagnostics for” label. The diagnostics groups are turned on by selecting the checkbox to the left of the group name. When a diagnostics group is enabled, a check mark is shown to the left of the group’s name.
Some of the items in the list are actually groups of diagnostics groups. These super-groups are purely for organization and generate no diagnostics. The subgroups within a super-group may be viewed by selecting the tree-view plus or arrow symbol to the left of the name. This action will be shown in this manual as Super-Group, then Sub-Group. When any of the diagnostic subgroups in a super-group are enabled, a check mark is shown to the left of the super-group name, in addition to the check mark to the left of each sub-group name. Any number of diagnostics groups may be enabled at the same time. When you select a Super-Group check mark, it uses a tri-state: All On, All off, previous sub-group selection.
Figure 3.1
Context Filtering
Every diagnostic message is generated within a specific context. Contexts are details about the source of a diagnostic message. The contexts for a message may include the Object, Slot, Timestep, and/or Rule within which it originated.
Diagnostic context
Diagnostic context identifies the Object, Slot, Timestep, and/or Rule from within which a message is generated.
All messages which are part of the same diagnostics group will have the same types of contexts. The contexts which are part of each diagnostics group are indicated by a symbol(s) to the right of the diagnostics group name. Following are the icons representing each context type.
• Object context 

• Slot context 

• Timestep context 

• Rule Context 

• Account Context 

• Goal Context 

Each of the icons contains a letter abbreviation of the type of context, O for object, S for slot, T for timestep, R for rule, A for account, and G for optimization goal. Not all Diagnostics Configuration dialogs contain the same contexts. Table 3.1 summarizes the contexts available to all of the Diagnostics Configuration dialogs.
Diagnostics Configuration Dialog | Available Contexts |
|---|---|
Simulation | Object, Slot, Timestep |
Rulebased Simulation | Object, Slot, Timestep, Rules |
Optimization | Object, Timestep, Goal |
Workspace | Object, Slot |
Accounting | Object, Slot, Timestep, Account |
Exactly how many icons are displayed depends on the Diagnostics Configuration dialog invoked, as indicated in the table above.
Context filters are important for reducing the number of messages produced by a diagnostics group. Context filters allow you to specify the only sources from which a diagnostic message will be displayed. Any messages originating from a different source are ignored.
Most diagnostic groups are affected by context(s). To the right of every diagnostic group listed in the Show diagnostics for field, there are zero or more context icons indicating whether or not those particular types of diagnostics are generated within the depicted context types. For example, the posting of diagnostic group Dispatch Management, then Slot messages is affected by the Slot and Timestep context. Both the Slot and Timestep context icons appear to the right of the listed diagnostic group. In this way, you can determine whether selecting a limited set of items within a context type will affect the frequency of messages of a particular diagnostic group. Choosing a limited set of slot names, for example, only affects the frequency of diagnostics groups depicting the slot context icon S.
The summary context icons above the diagnostic group list box indicate whether or not diagnostic groups affected by the specific context are turned on. If none of the diagnostic groups are turned on, then diagnostics are not generated from any of the existing contexts. As a result, each of the summary context icons above the list box is turned OFF, and each has a red line through it. As soon as a single diagnostic group is turned ON and is related to a specific context, the corresponding summary context icon is turned ON (the red line is removed.)
Enabling the Dispatch Management, then Controller diagnostics group for a model with 60 objects and 5 years of 1 Month timesteps, would generate at least 3600 messages. This is too many messages to look through to verify that a particular object dispatched on a particular timestep. Because the diagnostics group has both object and time context (as indicated by the symbols to the right of its name), we can set context filters to ignore all messages which did not originate from the desired object and timestep. This reduces the number of diagnostic messages to look through from approximately 3600 to 1. |
Object List
The object list in the Simulation Diagnostic Configuration dialog contains a list of the objects for which applicable diagnostics will be generated. To add or delete members of the list, use the Select button under the Show O diagnostics for field. This displays the Object Selector dialog. Highlighted objects within the list may be removed directly with the Remove button.
Timestep Selection
In the upper right corner of the Diagnostics Configuration dialog, there is a Show T diagnostics for field, which allows you to input the times within which diagnostics (affected by timestep context) will be generated. By default, diagnostics are posted from the start of the run to the end of the run. This can be overridden by selecting the toggle buttons to the left of the From and To fields. In addition, there is a toggle to specify the Run Start and Run End. The date/time spinners to the right of text fields can also be used to select the desired times.
Slot List
The Slots list is modified in the same manner as the Objects list.
Rule List
In the Rulebased Simulation Diagnostic Configuration dialog, a box is displayed to allow you to select rules for which diagnostics should be displayed. See Selecting Rules for details.
Accounts List:
In the Accounting Diagnostics Configuration dialog, a box is displayed to allow you to select accounts for which diagnostics should be displayed.
Goal List
In the Optimization Diagnostic Configuration dialog, a box is displayed to allow you to select goals for which diagnostics should be displayed.
Select All, Revert, and Clear
These three menu options are available within each of the diagnostics configuration dialogs, depending on whether or not they exist in the specific Configuration dialog. Each of these options can be applied to diagnostics groups, the object list, the slot list, the rule list, and the timestep text fields.
• Applying the Select All feature has the following effects:
– Diagnostics Groups: All turned to ON
– Objects: ALL listed in listbox
– Slots: ALL listed in listbox
– Rules: ALL listed in listbox
– Goals: ALL listed in listbox
– Times: Set to StartTime and EndTime
• The Revert feature reverts the appropriate items back to their state prior to your modifications. Every time the Apply button is pressed, your changes are recorded. Selecting the Revert command will revert back to the settings which were last recorded.
• Applying the Clear feature has the following effects:
– Diagnostics Groups: All turned to OFF
– Objects: NONE listed in listbox
– Slots: NONE listed in listbox
Diagnostic Output Window
The Diagnostics Output Window displays the diagnostics during a RiverWare run. Error and Warning messages are also displayed in this window, regardless of user settings, and automatically force the window to the top of any other windows. The object and timestep for which a message is generated are listed under the Context bar. The message containing the diagnostic information is listed under the Diagnostic Message bar on the same line. When the Auto Scroll checkbox is selected, the window will continually scroll down as messages are output. In a large model where many diagnostics are generated, the continuous scrolling can add significantly to the run time. In these cases, Auto Scroll can be disabled by clearing the checkbox.

You can scroll vertically and horizontally in both the context and message fields. In addition to scrolling in the fields, you may wish to resize the entire Diagnostics Output Window. This is useful when many long messages and/or contexts need to be read. To move the divider between the fields, position the mouse over the space between the heading bars, press the left mouse button, and drag the divider to the desired width.
Long diagnostic messages are shown as a wrapped tooltip when you hover over a message.

• In the Diagnostics Output Window, the following right-click context menu operations are available:

• Open Context <Item>. Open the dialog for the listed item:
– Object,
– Account,
– Slot,
– RPL Set,
– RPL Rule,
– RPL Goal, or
– RPL Group
• Open RPL Expression Causing the Error. When an error occurs in RPL evaluation, this menu becomes available. When selected, the appropriate RPL dialog will be opened and the expression causing the error will be selected.

• Copy Context Timestep. Copy the datetime to the clipboard
• Global Scroll to Context Timestep. Global scroll to the datetime
If you wish to read a diagnostic in a wrapped window, right-click the line of text and choose Show Message in Popup Window.

This opens a dialog that shows the full diagnostics text, including the context, in a wrapped window. If you highlight the name of an Object, Slot, Account, RPL item (Set, Group, Rule, Function), you can select the Open Selected Named Item menu to open the corresponding dialog.
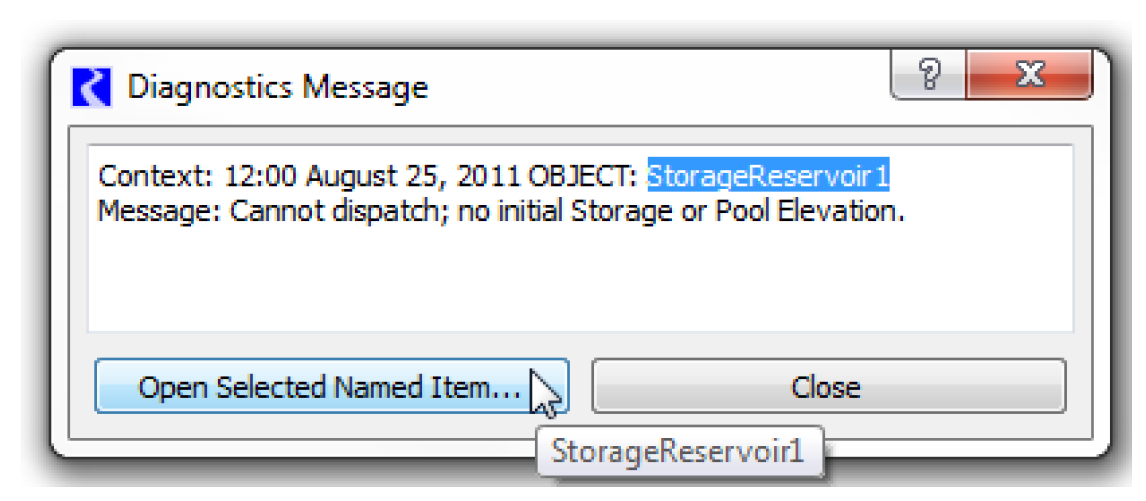
The same right-click context menus listed in the bullets above are available in this dialog too. The keyboard accelerators Ctrl-A for Select All and Ctrl-C for Copy are also available on the text in the dialog.
Message Search and Filter Controls
There are two approaches used to find messages: Search and Filter. Search to look for a specific text string row by row. Filter to show all rows that match the text string. (You can also search on filtered results) The two approaches share the text entry field. Following are descriptions of the controls and options:
Figure 3.2

Search Controls
The Search controls include: the following:
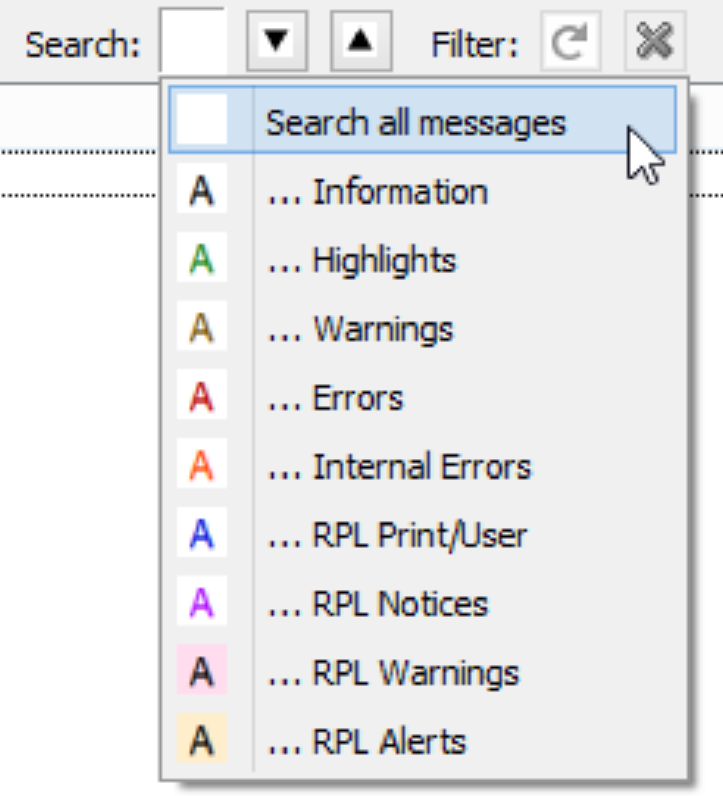
• Message Type (color coded) menu. Filter the search by the type of message displayed, i.e. by color. Select the white box just to the right of the Search field. This opens a menu (see Figure 3.3). Choose an item and any subsequent searches will be filtered to only include messages of that type. If you just want to see the next message of a certain type, don’t enter anything in the search box; a search will jump to the next message of the indicated color/type.
Figure 3.3 Diagnostics search message type filter menu
• Search Forward button (down) 

• Search Backward button (up) 

Note: The Add entered text as User Message selection in the Edit menu can be used to effectively append a bookmark to the end of the message list. That text can later be recalled from the history menu of the entry field, and used to scroll to the various instances of that bookmark within the message list using the search functions.
Filter Controls
Filtering allows you to show only those lines that match the specified text. The Filter controls include the following buttons:
• The Apply Filter button  applies the entered text as the active filter pattern. Message rows not matching the pattern are hidden. This button is disabled when the search / filter parameters already match the currently active filter (or when the entered text is empty).
 applies the entered text as the active filter pattern. Message rows not matching the pattern are hidden. This button is disabled when the search / filter parameters already match the currently active filter (or when the entered text is empty).
 Figure 3.4
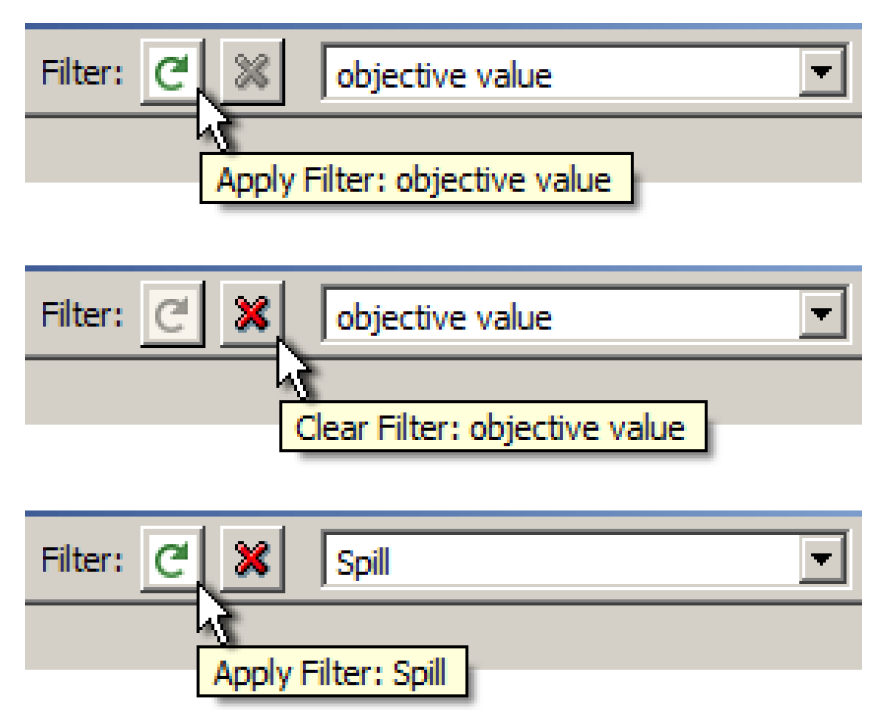
• The Clear Filter  button clears filtering -- causing all message rows which had been hidden to become visible again. This button is enabled only when filtering is active.
 button clears filtering -- causing all message rows which had been hidden to become visible again. This button is enabled only when filtering is active.
 The only direct indication that messages are being filtered is the Clear Filter (red “X”) button being enabled and discontinuous line numbers in the message list.
When applying or clearing a filter, the view is re-scrolled to the currently selected item (when that item remains non-hidden). So, it is possible to use filtering to locate a diagnostic message (and select that message), and then view that message in the context of all generated messages by turning filtering off.
Search and Filter Parameters
Enter your desired search/filter text pattern in the text box. This is an editable “combo box” to support a history of recently applied patterns, as shown in Figure 3.5.
Figure 3.5
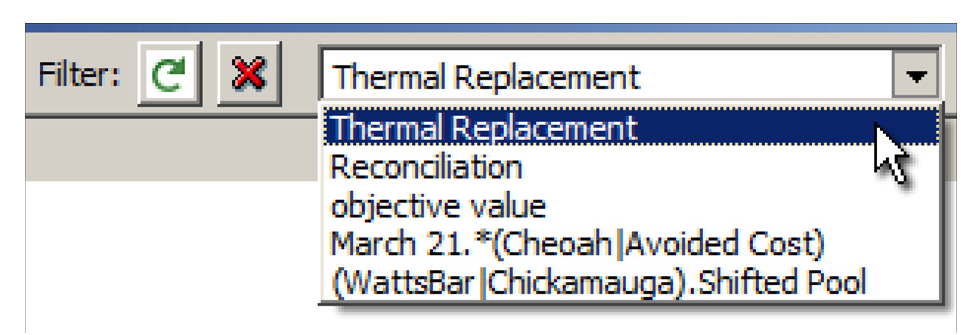
When typing in the entry field, hitting Enter is equivalent to selecting Search Forward, and pressing Shift-Enter is equivalent to selecting Search Backward.
The following options apply to both the Search and Filter functions.
• The Ignore Case checkbox causes upper/lower case differenced to be ignored when comparing the pattern text to message text.
• The RegEx checkbox changes the interpretation of the pattern text from “Wild Card” to “Regular Expression” syntax. (See the following section).
Note: The search functions skip over messages which have been hidden by filtering.
Search and Filter Pattern Matching Technical Details
A given message line matches the pattern if the line text contains the pattern. (This is different from the pattern matching the entire line of text). Application of the pattern match concatenates the “context” and “message” parts of the message row, rather than independently looking into those two parts. This makes possible, for example, a wildcarded expression which matches pieces from both the context and message parts of the message line, as follows:
February 23, 1996*Propagate*returnFlow
Figure 3.6

The following is the definition for wild card pattern matching (i.e. not RegEx):
• Any character represents itself apart from those mentioned below.
• “?” (question mark) matches any single character. It is the same as “.” (period) in regular expressions.
• “*” (asterisk) matches zero or more of any characters. It is the same as “.*” (period asterisk) in regular expressions.
• Sets of characters can be represented in square brackets [...].
• A back-slash (‘\’) “escapes” the wild card characters. It is possible to match a question mark, asterisk, or square bracket by preceding (“escaping”) those characters with a back-slash (“\”).
Regular Expression (“RegEx”, “regex” or “regexp”) pattern syntax is an advanced, potentially complex pattern matching format developed originally with Unix-based tools. It’s not described further in this document but is widely referenced online.
File Menu
The File menu includes the following selections:
• Save Diagnostic Messages to File. Save all diagnostics in the window to a text file
• Show Diagnostics Messages in Stand Alone-Window. When the diagnostics output is docked in an SCT, this menu option allows you to show the messages in a stand-alone window
• Show Workspace. bring the workspace to the front
• Close Diagnostics: Close the Diagnostics Output Window
Edit Menu
The Edit menu the following selections:
• Copy Message Line. Copy a single line to the clipboard
• Copy Visible Message Lines. Copy visible lines to the clipboard
• Copy All Message Lines. Copy all the diagnostics to the clipboard
• Add entered text as User Message. This option takes any text that is in the Search text box and creates a new message line. This is useful in debugging if you want to place a marker
• Clear Messages. This command clears the existing diagnostics from the scrollable listbox. During the course of running RiverWare with diagnostics enabled, the number of diagnostics can grow very large (especially if they are being generated for <ALL OBJECTS> and <ALL SLOTS> context types, and all Times). As a result, Clear Messages whenever possible to decrease the amount of memory used by RiverWare. Diagnostics are appended to the bottom of the window and are not deleted from the window until you invoke the Clear Messages command. As a result, if you are making multiple runs, the diagnostics from the first run remain visible at the top of the window. When looking at diagnostics, make sure to always start at the bottom to ensure you are viewing diagnostics from the current run.
Settings Menu
The Settings menu includes the following selections:
• Diagnostics Manager. Open the diagnostics manager.
• Show Color Legend. Display the meaning of diagnostic message colors.
• Show Column Headers. Toggle to either show or hide the column headings.
• Show Line Numbers. Toggle to either show or hide line numbers.
• Show Filter Statistics. Toggle to either show or hide a statistics panel below the message list. This indicates the total number of diagnostics messages, and how many are shown and hidden due to message filtering.
• Show Horizontal Scroll Bars. Toggle to either show or hide scroll bars
• Search/Filter: Ignore Case. Toggle to ignore case in the search/filter box.
• Search/Filter: Use Regular Expressions. Toggle to use Regular Expressions in the search/filter box.
• Automatic Width Adjustment. The Context portion of the message list (on the left side) is given the full width necessarily to display its content for all non-hidden messages.
• Extra Width Fix. This option is intended to correctly measure the text content on certain Windows machines. When this option is on, automatically adjusted widths are increased by about 12%
Revised: 01/05/2024