Output Devices
File Size Reduction of Generated Images
A significant reduction of the size of generated image files was applied to:
• Image files generated for model reports.
• Image files created as part of the chart animation video generation.
In some cases, the file sizes were reduced by a factor of 30 without any impact on image quality.
Charts
The following changes were made to Charts:
• Within the configuration, a new tab has been added for setting fonts on all chart labels.
• A checkbox option was added to show/hide the chart date.
• An option was added to not to show the legend on the chart.
• On bar charts, sizing options were provided to configure the bar width proportion.
For more information, see Configuring Charts in Output Utilities and Data Visualization.
Model Reports
Model Reports provide a way to export information about a RiverWare model or run to an HTML file. Following are changes and improvements to the Model Report:
Embed Images in HTML
A new Model Report setting was added: Embed Images in HTML File with options: Yes/No Selecting Yes (the default on new reports) embeds images in the HTML file. This makes it easier to send the generate HTML file via email or file transfer. Selecting No, creates a sub folder in the specified directory where all images are stored. For more information, see Report Settings Area in Output Utilities and Data Visualization.
Ensure HTML and add HTML to File chooser
To make it easier to define the HTML file to use, the following changes were made:
• Automatically add .html extension if not specified.
• Provide a file selection filter for efficient selection of HTML files.
Text Items
The Model Report Text item (Text in Output Utilities and Data Visualization) allows you to add rich/formatted text to your report. The following enhancements have been implemented:
• Superscript and Subscript formatting is supported under the Format menu.
• Using the Tab key, four space characters are added to mimic a tab.
Show/Hide individual Descriptions and Comments
Finer control was added to allow you to specify which Descriptions or RPL Comments are shown in the report. Yes/No settings for showing descriptions and RPL comments were added to Object, Slot, RPL Set, RPL Group and RPL Rule/Goal items.
In a large model report, it could be quite time consuming to turn on or off all of these new settings. For this reason, the following four operations, have been provided under a new Settings menu.
• Show All Descriptions
• Hide All Descriptions
• Show All RPL Comments
• Hide All RPL Comments
Run History Item
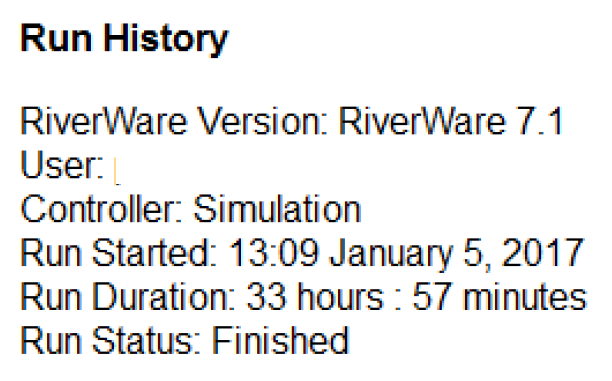
A new Run History item was added to allow you to optionally show the following pieces of information in a report:
• RiverWare Version
• User
• Controller
• Run Start Time
• Run Duration
• Run Status

See Model Info and Run History for more information on the new Run History. See Run History in Output Utilities and Data Visualization for information about this report item.
Output Canvas
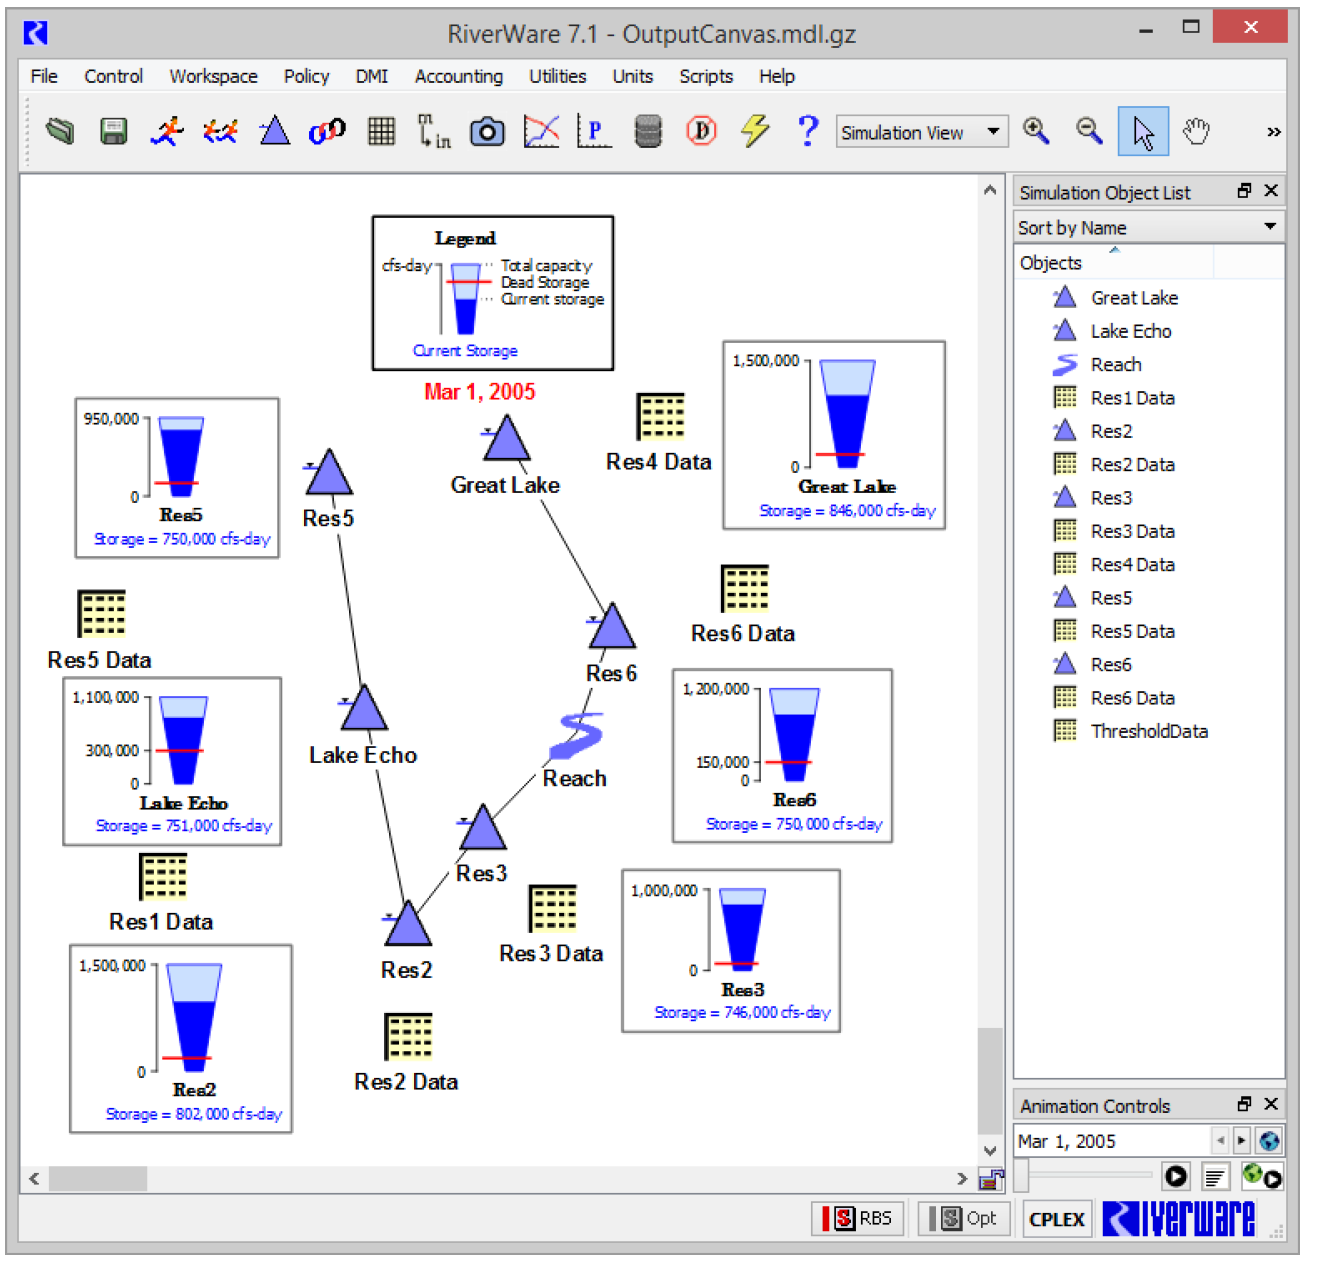
The Output Canvas, described in Output Canvas in Output Utilities and Data Visualization, allows for visualization of outputs in spatially distributed teacups and flow lines. The following improvements have been added to the Output Canvas:
Resizable charts, icons, and images
A scaling factor has been added to the Output Canvas configuration for individual icons and images. In addition, an anchor point feature has been added to charts for resizing the chart on the canvas.
Printing to Paper and to PDF
Print Preview and Print submenus have been added to the generated output canvas File menu. If you have a PDF print driver, you can print the Output Canvas directly to a PDF file
Teacups / Charts / Text shown on workspace
New Output Canvas settings were added to Show on Simulation View and Show on Geospatial View. When enabled, the canvas teacups, charts and text are shown on the appropriate workspace canvas views. You can move the items on the workspace, but all other configuration is performed on the Output Canvas editor. For more information, see Animation in Output Utilities and Data Visualization.
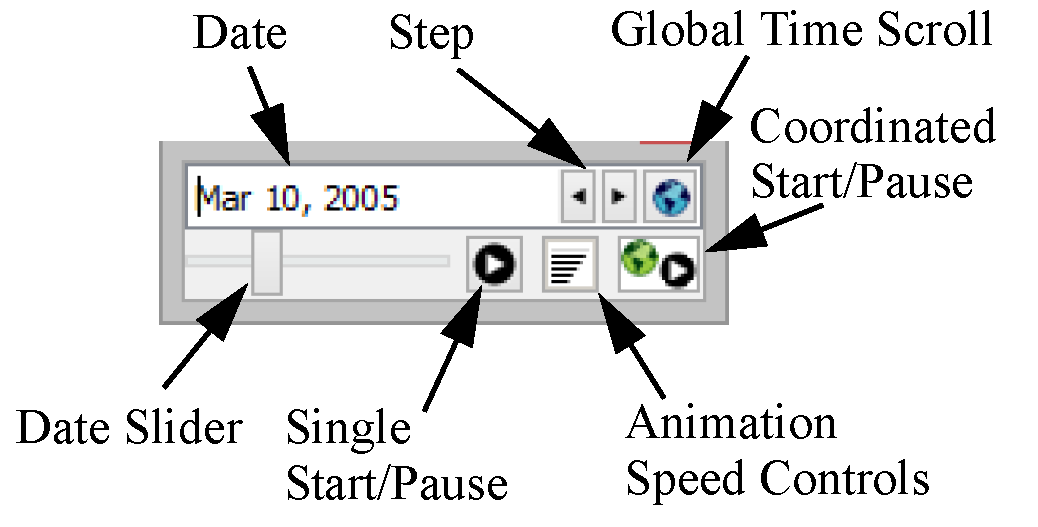
As part of this work, the datetime spinner and animation controls were added to the workspace as a dockable panel below the object list. Use this to advance canvas items through time.

For more information, see Output Canvas Items and Animation Controls in User Interface.
Coordinated Animation
Charts and Output Canvas can be animated through the run period. Now, there is a Coordinated Start button that allows all relevant dialogs to animate together. When the icon is pressed, all slider/spinners move together in coordinated time. For more information, see Animation in Output Utilities and Data Visualization.

Plotting
Inconsistency for Patterned Line Appearance
Plots with patterned lines (dash, dot, etc) with a width of two pixels or more were displaying differently on the plot versus the legend. To remedy this inconsistency, the display of curves on the plot was improved to match the legend. As a result, existing plots may look different than in previous versions.
Marker Labels
Previously, marker labels were tied to the marker line. They did not display unless a line style was selected. Now Marker Labels can be shown without a line; that is, they can be shown to label a specific point on the plot without a line.
Editing Multiple Curves and Graphs
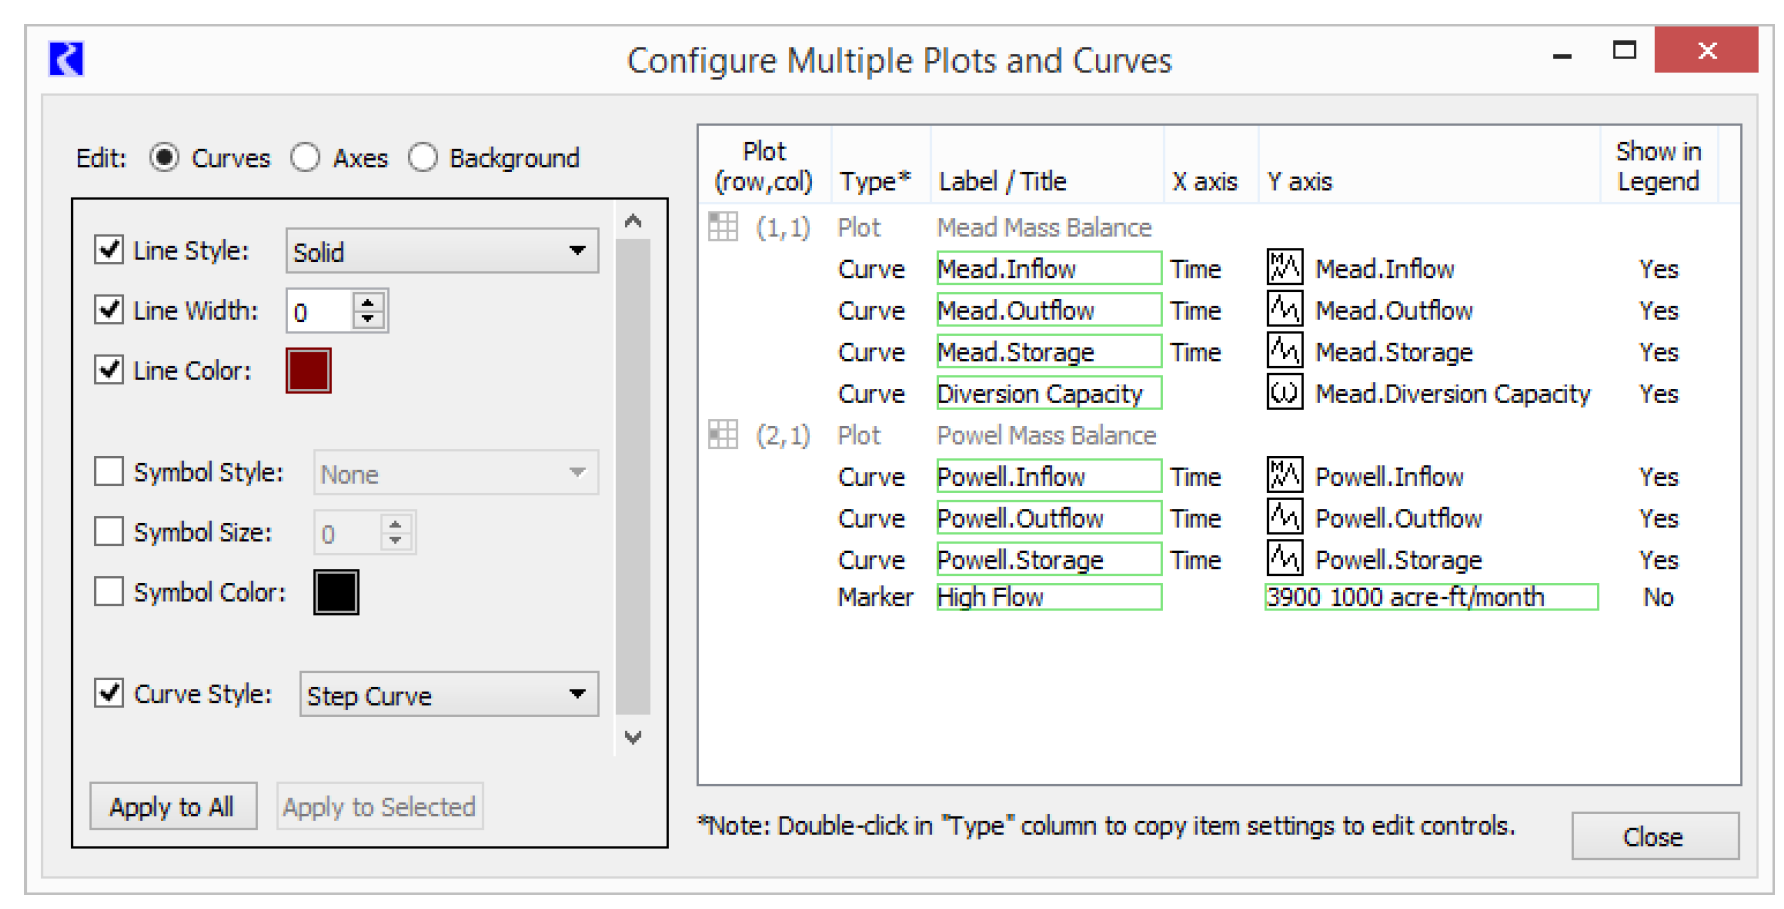
The new Configure Multiple Plots and Curves dialog provides centralized plot editing controls. Most plot settings for the supported nine separate plots within a plot page are editable within the new Configure Multiple Plots and Curves dialog. You can select multiple items within a plot page, e.g. curves and markers, and apply selected settings to those items in a single operation. For more information, see Configuring Multiple Plots and Curves in Output Utilities and Data Visualization.

User Specified Axis Units
Each axis is now associated with a particular unit type (e.g. flow) rather than being limited to a specific scaled unit. The user can switch the scaled units associated with an axis between:
• the scaled units of the first slot assigned to the axis,
• user-specified scale and units (among the units supported for the axis' unit type).
More information can be found Axis Configuration in Output Utilities and Data Visualization.
Copy/Paste of slots to/from the slot clipboard
Copy and Paste of slots from the slot clipboard was reinstated. Slot curves are added to the plot as long as axes having the slot curves' unit types are available.
Tabular Series Slot Reports
Omit Slots Behavior
Tabular Series Slot reports now have an improved Omit slots behavior. The change in filtering is as follows:
• old behavior: omit slots containing only NaNs or zeros (exact value)
• new behavior: omit slots displaying only NaNs or zeros as values
The important difference is in the checking for values that are exactly zero versus values that are displayed as zero. With the new functionality, the display precision is taken into account when checking for zero values. The new Omit slots options are now as follows:
• displaying only NaNs
• displaying only NaNs or zeros as values
More information is available Settings Tab in Output Utilities and Data Visualization.
Revised: 12/06/2024