Slot Analysis
In this approach, you perform analysis of slots in the model. Initially, you can create multiple linear regression of series slot data.
Series Data Analysis Sequence
In this approach, you analyze slots that are in the model. You select the slots and analysis options in the DAT or the script actions. An example DAT use-case is described by the following sequence. Remember that many of these can be automated using scripts as described in Script Actions for Working with Data Sets.
1. In the model, determine what slots you want to use for the series regression. These could be inputs, outputs, or both.
2. Open the DAT as described in Accessing the Data Analysis Tool.
3. Select Analyze and select Analyze Slots from Model.
4. The only option is selected at the top: Compute Series Regression. Use the window to specify the Values for various Settings. In particular, select the Dependent Slot and one or more Independent Slots.
5. Specify the desired output options.
6. Select Perform Analysis when ready.
7. Based on the selections, the resulting data will be added to slots on new or existing Data Set objects. Open the objects from the DAT or the workspace and view or plot the data.
8. If desired, use the “Visualize” button to create custom data views of the RDF data or the analysis results. Data Views of the dependent and fitted data are supported.
9. If specified, the Data Set objects will be saved in the model file and can be accessed for additional investigation.
How to Use the Data Analysis Tool for Series Analysis
The Data Analysis Tool allows you to analyze series slots using linear regression. This section describes these operations.
Analyzing Series Data
Use the Analyze button and then Analyze Slots from Model to initiate the analysis.
The following types of analysis actions are supported by the Data Analysis Tool. These correspond directly to the types of analysis supported by the script actions. See the script documentation for the specific details of each analysis type.
Table 7.2 Analysis actions for model slot data
Analysis Action (data type) | Link to Script Information |
|---|---|
Compute Series Regression (on series data, from the current model) |
When you select Analyze and then Analyze Slots from Model, the tool presents a modal dialog that allows you to configure and perform the analysis as shown in Figure 7.3
Figure 7.7 Screenshot of Analyze Data Set dialog
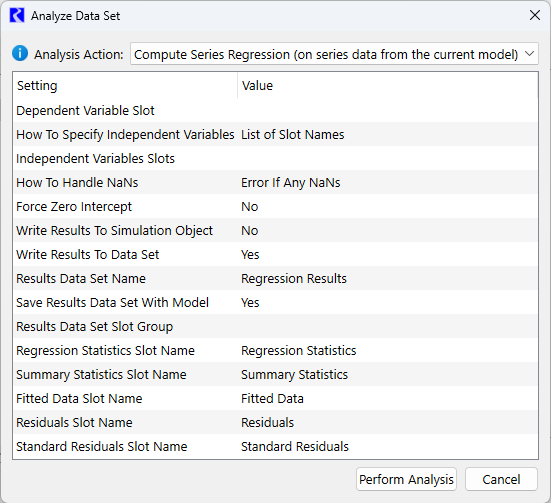
Select any item in the right column to initiate editing. For example, select the button in Dependent Variable Slot value to get a slot selector, as shown in Figure 7.8. Documentation of the various options are in the script documentation, with links in the table above, Analyzing Series Data.
Figure 7.8 Screenshot of editing while using the Analyze Ensemble Data Set dialog

Warning: Ensemble data analysis is not supported for aggregate series slots. Including aggregate series slots in ensemble data analysis will result in an error.
The result of the regression is shown in the screenshot.
Figure 7.9 Resulting DAT view of a Compute Series Regression
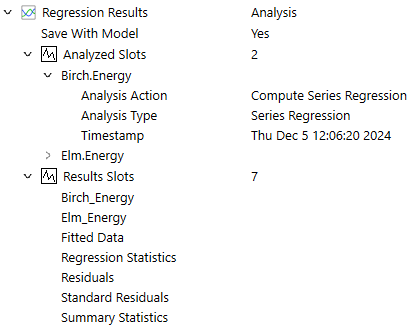
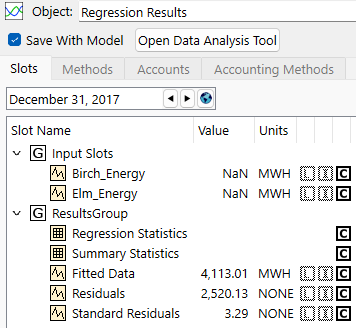
Then, the slots are on the destination object organized as groups, as defined. For example, in the screenshot below, the results are the two input slots and 5 regression slots.
Figure 7.10 Resulting slots from a Compute Series Regression
Visualizing Data Sets
Use the Visualize button to create plots as Data Views in the DAT and/or Plot Pages. The tool presents a modal dialog that allows you to configure the visualization, as shown in Figure 7.11
Figure 7.11 Screenshot of Visualize Ensemble Data Set
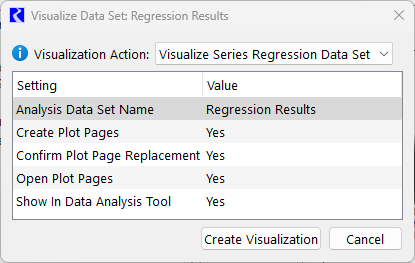
First select from the menu the type of visualization you’d like to perform. Then select any item in the right column to initiate editing. For example, select whether to create plot pages , as shown in Figure 7.12. Documentation of the various options are in the script documentation, Visualize Series Regression Data Set in Automation Tools.
Figure 7.12 Screenshot of editing while using the Visualize Data Set dialog

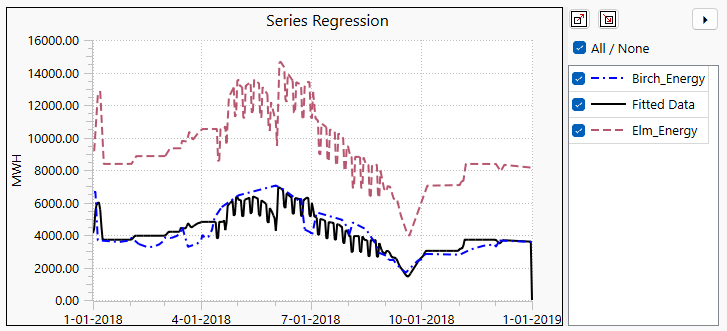
Once satisfied, select Create Visualization and the specified Data Views and/or Plot Pages will be created. Here is a sample.
Figure 7.13 Sample Data View from Visualization of a Compute Series Regression operation
Revised: 01/10/2025